Thursday, February 6, 2014

Natural Gas: Big Storage Withdrawal Lower Than Inflated Expectations, Futures Fall

Platts' survey of analysts had the pull at 273-277 Bcf while a couple guys guessed 300 Bcf.
The futures are up a dime at $5.13 after trading as high as $5.396.
From MarketWatch:

Natural-gas futures pare gains after EIA data
AN FRANCISCO (MarketWatch) -- Natural-gas futures on Thursday pared some gains after the U.S. Energy Information Administration reported that supplies of natural gas dropped 262 billion cubic feet for the week ended Jan. 31. The drop was a bit below expectations as analysts surveyed by Platts forecast a decline of between 273 billion cubic feet and 277 billion cubic feet. Total stocks now stand at 1.923 trillion cubic feet, down 778 billion cubic feet from a year ago and 556 billion cubic feet below the five-year average, the government said. March natural gas NGH14 +1.87% was at $5.07 per million British thermal units, up 4 cents, or 0.8%. It was trading at $5.11 before the data.
The withdrawal was really quite large, the 5-year average for this week is 143 billion cubic feet but this is all about the second derivative: How do you think X will react to Y's expectation?
No bets on direction at the moment.

"Ex-Barclays Carbon Chief Redshaw Trades From Home as Prices Jump"

The thing all the carbon cowboys should have put on the biggest monitor in the room:
It's Not An Organic Market!
Sometimes I crack myself up.
From Bloomberg:
Louis Redshaw, the former head of carbon trading at Barclays Plc, returned to the market amid a jump in permit prices since he left the bank in April.

Redshaw, who resigned from Barclays in London after more than eight years at the company, is buying and selling European Union permits for his own account from his home in the southeast of the capital, he said Feb. 4 by phone, declining to provide further details. Allowances climbed 24 percent this year, the fourth best performance of 80 commodities tracked by Bloomberg. They rose to their highest level in more than a year today, trading at 6.25 euros ($8.45) a metric ton on the ICE Futures Europe exchange in London.
EU lawmakers are completing details of a plan to curb an unprecedented oversupply and boost prices, which fell to a record in April. Allowances may rise to as high as 15 euros by 2015, according to Patrick Hummel, an analyst at UBS AG.

“There’s no reason why the market shouldn’t double within the next 18 months,” said Redshaw, who also worked as a trader at Enron Corp. and Electricite de France SA. “At 6 euros, it’s still cheap.”
Carbon trading volume on ICE jumped 21 percent to a seven-month high in January compared with December.

As well as postponing the sale of some permits, the European Commission is proposing a permanent reserve of allowances to smooth future surpluses or shortages starting 2021....MORE
If they didn't like the play on words they should at minimum have understood the sentiment of the first inductee into the Climateer Hall of Fame back in April 2007:

The 26th Secretary of War, the Democrat and Republican (!) Senator from Pennsylvania, Simon Cameron:

Our Hero
Simon Cameron
"The honest politician is one who 
when he is bought, will stay bought."

Attention Rainmakers: Koch Brothers VIP Donor List Found After Palm Springs Conclave

From Mother Jones:

The Koch Brothers Left a Confidential Document at Their Last Donor Conference—Read It Here
A list of one-on-one meetings between VIP donors and the Kochs and their operatives offers a revealing look into their mighty political machine.

There's one main rule at the conservative donor conclaves held twice a year by Charles and David Koch at luxury resorts: What happens there stays there.

The billionaire industrialists and their political operatives strive to ensure the anonymity of the wealthy conservatives who fund their sprawling political operation—which funneled more than $400 million into the 2012 elections—and to keep their plans private. Attendees of these summits are warned that the seminars, where the Kochs and their allies hatch strategies for electing Republicans and advancing conservative initiatives on the state and national levels, are strictly confidential; they are cautioned to keep a close eye on their meeting notes and materials. But last week, following the Kochs' first donor gathering of 2014, one attendee left behind a sensitive document at the Renaissance Esmeralda resort outside of Palm Springs, California, where the Kochs and their comrades had spent three days focused on winning the 2014 midterm elections and more. The document lists VIP donors—including John Schnatter, the founder of the Papa John's pizza chain—who were scheduled for one-on-one meetings with representatives of the political, corporate, and philanthropic wings of Kochworld. The one-page document, provided to Mother Jones by a hotel guest who discovered it, offers a fascinating glimpse into the Kochs' political machine and shows how closely intertwined it is with Koch Industries, their $115 billion conglomerate.

The more than 40 donors courted by the Kochs include hedge fund and private-equity billionaires, real estate tycoons, and executives of top corporations, including Jockey International and TRT Holdings, owner of Omni Hotels and Gold's Gym. A number of them have never been identified as members of the Koch donor network, including Schnatter, one of the more prominent names on the list. An outspoken opponent of the Affordable Care Act, he is a longtime Republican donor who hosted a fundraiser for Mitt Romney's presidential campaign. The document notes that the pizza mogul was scheduled to meet with Ryan Stowers, the director of higher education at the Charles G. Koch Foundation. (Schnatter did not respond to requests for comment.)

Another top conservative contributor on the list is TRT Holdings' cofounder Robert Rowling, whose net worth is estimated at $4.9 billion. During the 2012 election, Rowling directed $3.5 million to American Crossroads, the super-PAC spearheaded by Karl Rove, and he cut a $100,000 check to the pro-Romney super-PAC Restore Our Future. According to the document, Rowling was scheduled to sit down with Charles Koch at the "Koch residence"—presumably a reference to the Wichita businessman's vacation home at the Vintage Club, a short drive from the resort where the donor conference was held. Top Koch operatives were expected to participate in this session, including Kevin Gentry, the Koch brothers' fundraising guru; Daniel Garza, the director of the Libre Initiative, a Koch-funded organization dedicated to Latino outreach; and Marc Short, who runs Freedom Partners, the centerpiece of the Kochs' political network, which distributes donor funds to a large web of conservative nonprofit groups. (Rowling did not respond to requests for comment.)

Other heavy hitters slated for meetings with the Koch brothers or their representatives included Carl Berg, a Silicon Valley real estate tycoon worth $1.1 billion; Ken Griffin, who founded the hedge fund Citadel and clocks in at No. 103 on the Forbes 400 (net worth, $4.4 billion); John W. Childs, a top private-equity investor; and Fred Klipsch, the chairman of the headphone and speaker company Klipsch Group....MORE
Previously:
Attention Rainmakers: President Obama's Bundlers = Big Money
Attention Rainmakers: Worldwide, There are Now 185,795 People With a Net Worth of $30 Million or More
Attention Rainmakers: Here's The Wealth-X World Ultra Wealth Report 2012-2013
Prospect List: "Africa May Have Up to 200 Hidden Billionaires, Mobius Says"
Prospect List: The Romney Bundlers
"MJ Exclusive: The Koch Brothers' Million-Dollar Donor Club"

Société Générale's Albert Edwards Descends Into A Nightmare World of Dream Demons and Market Depravity

Or something.

From Business Insider:

ALBERT EDWARDS: The Markets Will Become Locked In A 'Freddy Kruger-Like' Nightmare That Takes Stocks Down To Levels Not Seen In A Generation
 Amid the turmoil in the emerging markets, Societe Generale strategist Albert Edwards is as bearish as ever.
"Our warnings throughout last year that an unravelling of emerging markets (EM) was the final tweet of the canary in the coal mine have still not been taken on board," he wrote in a new 6-page note to clients. "The ongoing EM debacle will be less contained than sub-prime ultimately proved to be. The simple fact is that US and global profits growth has now reached a tipping point and the unfolding EM crisis will push global profits and thereafter the global economy back into deep recession."

Profits and profit expectations are ultimate what drive stock prices. And the worry is that fragile and weak profit growth is about to make a big turn for the worse.

"One thing [SocGen's Andrew Lapthorne] has been highlighting for some months is just how incredibly anaemic profits growth has been in both the developed and emerging markets, the latter being particularly poor having contracted for the past two years," wrote Edwards.

The widely followed measure of profit growth are adjusted or pro-forma, which often has the affect of boosting earnings. However, even these numbers don't look good. Check out this chart:
earnings growth albert edwards
Societe Generale, Albert Edwards
Edwards pointed to this quote from Lapthorne:
Of course even these MSCI figures have been flattered by a reduction in the share count plus lower interest rates and tax charges....
...MORE
From the Nightmare on Elm Street wiki:
Frederick Charles "Freddy" Krueger was a child murderer who lived in Springwood with his family in the past and soon became an Dream Demon that kills his victims in their dreams, thus causing their death in the real world...

Wednesday, February 5, 2014

Facebook To Decide Which News Sites Live, Which News Sites Die

On the web no one can hear you scream.
From The Atlantic:

And Just Like That, Facebook Became the Most Important Entity in Web Journalism
The graph above tells maybe the most interesting—and definitely the most surprising—story of the past year of digital media.

It shows two years of referrals from Facebook and Google to the Buzzfeed Partner Network, a collection of websites (including this one!) that share their traffic stats with Buzzfeed. It quantifies what so many publishers have experienced: a massive surge of traffic from Facebook, unparalleled in its regular, day-after-day size and scope.

The graph comes from Peter Kafka, a reporter at the tech news site Recode, who notices that the graph validates Buzzfeed’s long-term bet that Facebook would eventually be more important than Google.
That’s true, though the graph interests me for three other reasons:
1. The kind of traffic surge from Facebook—so vertiginous to be almost hockey-stick-ish—wasn’t an accident. Facebook didn’t grow at that rate in 2013, especially among U.S. users, and “naturally” eclipse Google. As I’ve written before, Facebook’s directing that kind of traffic because it wants to direct that traffic—it wants to be a digital publishing kingmaker.

2. On the web, we rarely see search engine optimized (SEO) stories anymore. That’s partly because Google has gotten better at giving you the answers you want—for instance, what time the Super Bowl is. But it’s also because SEO journalism just doesn’t make commercial sense anymore. Social trumps search, at least when it comes to the attention that sells ads....MORE

Chartology: "Interest Rates May Tumble"

Our third post on the topic in recent days.
From Barron's Getting Technical column:

Fed tapering was supposed to raise rates. That isn't happening. Amid a flight to safety from junk, rates are on the verge of dropping sharply. 

Investors, pay heed. Technical analysis suggests that interest rates are on the verge of falling significantly.
The most important pattern right now is the potential double top nearing completion in the chart of 30-year Treasury rates (see Chart 1). The pattern marks two failed rallies at about the same level and looks similar to the letter "M." When the market moves below the center low of the "M," the pattern completes and the forecast will be for further losses.
Chart 1 30-Year Treasury Yield, Short Term
[image]
That center low is 3.56% and the top of the pattern is 3.98% (both levels rounded to two decimal places). Wednesday, the yield was roughly 3.64%.

If this support level breaks, a move down to 3.14% would be indicated by the size of the pattern itself. That would be more than a 50% retracement of the yield gain from last summer through the end of the 2013.
It sounds unlikely, given that the biggest buyer of bonds—the Federal Reserve—started to cut back on its purchases via the taper. Less demand means lower bond prices and higher interest rates. Yet, lower rates are what would happen if the double-top pattern breaks down.

Let's put this into perspective in the big picture. A monthly chart shows a strong trendline drawn from the 7.91% interest rate peak at the end of the yield bull market and bond price bear market in 1994 (see Chart 2). The trendline can be finessed all the way back to the ultimate yield peak and price low in 1981, though that is not important for this discussion....

...On the charts, the 10-year yield exhibits the same double-top pattern as its longer-term cousin, but it is not quite as far along in development (see Chart 3). And if we move to shorter maturities, which are increasingly influenced by the Fed's zero-interest-rate policy, the more distorted the pattern becomes. The two-year yield sports a choppy trading range barely above its financial crisis lows.
Chart 3
10-Year Treasury Yield
[image]
MORE

Recently:
Chartology: Citi on the 10-year Yield
"Interest Rates Are Still Heading Lower"
Chartology: Yields Lower, Then Higher (in line With DoubleLine's Jeff Gundlach)

Things You Don't See Every Day: The Whole Country Is Below Average

In temperature that is.
Except for that tiny bit of Florida the entire U.S. is colder than average.:

 
Some of those anomalies are pretty big, high temps 39 degrees cooler than avg in north Texas? Brrrr

Natural Gas: Sometimes You Get Lucky

After this morning's commentary with the front contract at $5.5260:
Here's the action, and before you ask, the only thing I know is the $5.75-5.80 line from 2010 is as good an overhead resistance point as I can think of so we're close.
The market got to  $5.737 before reversing and trading all the way down to $4.990.
Currently changing hands at $5.1830.
I shall now go throw up.

Here's MoneyBeat:

The ‘Widow Maker’ Proves Tricky for Natural-Gas Traders 
Natural-gas trading patterns are predictable: Prices rise in the winter, when demand for gas-fueled indoor heating increases, and fall in the spring.

But in a market famous for large swings based on changing weather forecasts, correctly predicting the extent of the winter rise and the spring retracement can fell traders or even entire funds.

Bets on the winter-spring transition tend to come down to predicting whether the price difference between the March and April natural-gas contracts will widen or narrow. A bet on a wider spread indicates an expectation that winter prices will be much higher than spring prices, because supplies will tighten amid strong heating demand. Prices for April futures are usually lower than March prices because there’s little natural-gas demand for heating and additional demand from power plants to power air conditioners hasn’t yet kicked in.

Simple enough. But the trade is known as the “widow maker,” because a bet can go bad with a change in the weather.

Wrong-way bets on winter price moves cut the values of funds managed by Copperwood Energy Trading Advisors LLC and Skylar Capital Advisers LLP by more than 10% last March. And the March-April spread isn’t the only trouble spot in the risky gas market: Wild swings in natural-gas prices led to the collapse of hedge fund Amaranth Advisors LLC in 2006, after the firm lost $6 billion....MORE
Tomorrow we have the EIA's storage report.
Oh joy. 

From FinViz:

"3D Systems profit warning rekindles 3D printer bubble fears" (DDD; SSYS; AMAVF)

Long time readers know we don't really care for DDD, preferring Stratasys as a more viable industrial-scale 3D monger but the DDD news was bad for the whole group. Earlier we noted that class act Arcam was off 10%.
3D systems closed at $64.10, down $11.66 (15.39%) while SSYS was down 6.17% at $110.75. Arcam was down 6.54% at $43.74.

From Reuters:
3D Systems Corp slashed its profit estimate for 2013, reviving fears of a bubble in the 3D printing industry and sending its shares down as much as 28 percent.
Shares of other 3D printer makers also fell sharply after the profit warning from the largest listed 3D printer maker, which along with rival voxeljet AG has been the target of short-seller Citron Research.
3D Systems cut its 2013 adjusted profit estimate to 83-87 cents per share from 93 cents-$1.03, citing higher spending on research, manufacturing and marketing.

The company also forecast adjusted earnings for 2014 below the average analyst estimate.
Shares of 3D printer makers have had a good run over the past couple of years as the companies adapt to the consumer market a technology used by manufacturers for decades.

The technology was highlighted by U.S. President Barack Obama in his State of the Union address last year, when he said it had "the potential to revolutionize the way we make almost everything." (link.reuters.com/fuw85t)

However, 3D Systems said on Wednesday demand for its consumer printers was softer than its expectation during the fourth quarter, while demand for its professional printers was stronger.
Citron Research last year accused the chief executive of 3D Systems of exaggerating advances in the technology and contributing to a bubble in shares of companies in the sector.

Citron also questioned voxeljet's first-quarter results, saying the company extended loans to customers to generate sales and avoid posting a loss.

Stratasys Ltd shares fell 12 percent on Wednesday, Exone Co dropped 13 percent and voxeljet fell about 10 percent.

3D Systems shares have gained 60 percent in the past six months, while Stratasys jumped 31 percent. Voxeljet shares doubled on their market debut on October 18.

PRINTING GROWTH
3D Systems said it was willing to tolerate earnings reduction and gross profit margin compression in the near term to accelerate its growth rate and market share.
The company is positioned to double revenue over the next couple of years on organic growth of at least 30 percent, CEO Avi Reichental said in a statement....MORE
Earlier:
There's a Reason It's Called GLOBAL Macro: 3D Printing--Belgium's Materialise Buys Poland's Leading Rapid Prototyping Co.
See also last Friday's "Bloomberg Speculates On 3D Printing Co. Buyouts (DDD; SSYS; AMAVF)"
And dec. 4's "Whitney Tilson on Shorting 3D Systems (DDD)"

UPDATED--iRobot Reports Q4, Violates Asimov's 1st Law of Robotics (IRBT)

I. A robot may not injure a human being or, through inaction, allow a human being to come to harm.

In early after hours trade the stock is down 26 cents reversing the day's 13 cent gain. $34.11 last.
Update: now down $2.17 at $32.20.

From StreetInsider:
iRobot Corp. (IRBT) Tops Q4 EPS by 1c; Issues Light Q1 Outlook
iRobot Corp. reported Q4 EPS of $0.11, $0.01 better than the analyst estimate of $0.10. Revenue for the quarter came in at $126.5 million versus the consensus estimate of $125.5 million.

iRobot Corp. sees FY2014 EPS of $1.00-$1.15, versus the consensus of $1.15. iRobot Corp. sees FY2014 revenue of $560-570 million, versus the consensus of $553.1 million.

iRobot Corp. sees Q1 2014 EPS of $0.13-$0.17, versus the consensus of $0.28. iRobot Corp. sees Q1 2014 revenue of $110-113 million, versus the consensus of $121.22 million.... 

For Investors With The Attention Span of a Gnat: "Looking for Action? S&P 1500 Most Volatile Stocks"

From Bespoke Investment Group:
For traders with a short-term time horizon who are looking for big moves over a short period, we have updated our list of the S&P 1500 stocks trading above $10 that have the largest intraday high-low ranges (based on the average percent spread between the intraday high and low over the last 50 days).  The stocks are grouped based on whether they have a rising or falling 50-day moving average (DMA).  Stocks highlighted in gray are new to the list since our last report.

Due to the recent sell off in equities, just seven of the 50 stocks listed have rising 50-day moving averages.  Interestingly, even though overall volatility has picked up, there are still only three stocks (PVA, ZLC, and ANIK) that have average intraday high-low ranges of more than 5% over the last 50 trading days....MORE

Capital: "The tyranny of land"

Thank goodness a real journalist took on this subject matter. I was going to stitch something together after I saw Ryan Avent's piece at The Economist, trying to time it with the next bungee jump in natural gas but seeing how Izabella was actually talking about the topic over the course of the last couple years, gentle reader is in much more capable hands.
From Dizzynomics:
The fantastic Karl Smith is blogging on FT Alphaville at the moment, and I just wanted to direct everyone’s attention to one of his most recent posts.

It’s really good.

He jumps off the work of Piketty, to make the argument that land capital is capital but of an entirely different order. This is mostly due to its non reproducibility.

Smith argues — and I fully agree — that a key attribute of capital is that it tends to increase over time. What’s more, as the quantity of capital increases, the return to capital is driven down.

It is all about the return on capital vs. the growth rate of the economy. When capital returns fall below the growth rate of the economy, the economy adapts to diminish the capital stock. So capital stock expands for as long as returns are outperform the growth rate of the economy, but declines once they stop doing so.
He uses the dotcom boom to illustrate the phenomenon. As the value of tech stocks rose, the economy responded by producing ever more tech stocks — until of course there were too many, and it became clear not all of them could be winners in a crowded space that depended on scaleability, popularity and economies of scale.

Infinite value went to zero value very quickly — unless you were in the lucky position of being the best of the best — as the system reordered itself to diminish the oversupply of idle or unnecessary capital in the system.
Two key pars:
This automatic correction mechanism is not an anomaly but a fundamental feature of capital. Because capital is reproducible, high valuations invite competitors. Competitors soak up the oxygen and drive the valuations back down. Land does not have this correction mechanism and, as Piketty shows, land in the Ancien Regime of France was twice as valuable — relative to the economy — as capital ever has been.
——–
In the wake of the subprime crisis, I understand the temptation to rally against big banks and global finance. However, Lehman Brothers is dead. Sam Zell, founder and CEO of Equity Residential, is still alive. This is not an accident. The future does not belong to high flying titans. It belongs to dogged men and women who squirrel away rent checks when times are good, and buy your home when times are tight. This is the tyranny of land. Ignore it at your peril.
Ultimately, the value of land is two fold: productive (i.e. how it can be used to produce a crop yield) or access-based (who is allowed to occupy or build on it)....MORE
Here are the backround links:
Smith:  Piketty and the case for land capital
Avent on Smith: Inequality: Capital and land
Smith responds: Not All Forms of Wealth Are Equally Pernicious

And if you'll excuse me, the natural gas market appears to be completely off its meds today, $5.084 after trading above $5.70 a few hours ago:


Chart: 500 Years of Energy Prices

Wary reader will note a couple problems with this chart.

1) Having an arithmetic scale on one side of the chart and a logarithmic scale on the other makes for a nice fitting of the lines but is generally frowned upon.
2) A more informative presentation would be the cost of energy in BTU's per pence.

So why post it?
GFD has some of the most amazing databases around and one day I may want to do a quick-and-dirty on British lumber prices in 1700, et voilà! 

From Global Financial Data (red line: wood, blue: coal, pink: oil):

https://www.globalfinancialdata.com/gfdblog/wp-content/uploads/2013/06/500-years-energy.png
In today’s markets, when we discuss Wood/Lumber prices as a commodity, it is often related to home building and used by some as a economic indicator as a strength or weakness in the home building segment.

What most don’t realize however, is that Wood has traded as a commodity for over 5 centuries as an Energy source. It wasn’t until Coal and Oil became common place for the commodity to lose it appeal as a major traded commodity.

Wood has been and still is today, a primary source of energy. From cooking and heating to producing steam, we have seen its role change throughout our history. As the use for wood grew, more Europeans discovered uses for the commodity especially after they started using it in furnaces in the steel making process. As the uses for wood continued, Europe began to see rapid deforestation especially from the 15th -18th century. What became clear in Europe, is that the trend of the deforestation simple could not continue. By the 1550’s, the English Parliament began passing laws that restricted the use of Wood as a fuel source. In addition, when England went to war with France in 1620, wood and lumber began to show signs of a severe shortage. In order to build its fleet of ships to continue its war efforts, England had to import all of its wood from Scandinavia and from the colonies in the America. Spain who was also active in ship building and war, felled huge sections of its forest to build the famous Spanish Armada. Once the fleet was lost, Spain didn’t have  enough to rebuild it and sought out new supplies of wood from all over the world....MORE

Academic Paper of the Day: "Multitasking on a Single Device: Arousal and the Frequency, Anticipation, and Prediction of Switching Between Media Content on a Computer"

My gift to readers for fouling up the link on the BuzzFeed Style Guide post.
From the Nieman Journalism Lab:
“Multitasking on a Single Device: Arousal and the Frequency, Anticipation, and Prediction of Switching Between Media Content on a Computer”: From Stanford University, published in Journal of Communication. By Leo Yeykelis, James J. Cummings, and Byron Reeves.

The study looks at multitasking from a slightly different angle than many prior studies do — namely, the toggling between content on just one device (as opposed to multiple device usage). The researchers experimented on 12 undergraduates using their personal laptop in a natural setting, generating “396,000 data points equaling 110 hours of moment-by-moment changes in switching and arousal over 10 hours during a normal weekday.” Arousal was measured by “skin conductance levels” determined through wrist censors, which measure activation levels through the sympathetic nervous system.

Yeykelis, Cummings, and Reeves determine that, on average, subjects switched content every 19 seconds — faster than expected based on prior literature. In fact, “One-fifth of all content was viewed for 5 seconds or less, with 75 percent viewed for less than a minute.” Email and Facebook took up a quarter of all subjects’ time online. Further, they “discovered that people have an anticipatory arousal spike 12 seconds before switching to [other] content.”....

Orszag: Marrying Your Sister Boosts Inequality

Hang on, I may have misread the headline.
From Bloomberg:

Marrying Your Equal Boosts Inequality
Rich and poor Americans are slowly but surely staking out separate lives. Increasingly, they have been moving to different communities, and more and more they are also marrying people of similar income and educational backgrounds. This is a phenomenon social scientists call assortative mating.

In 2005, 58 percent of wives with a high school diploma were married to men with the same amount of education, new research by economist Jeremy Greenwood of the University of Pennsylvania and three colleagues shows. In 1960, by contrast, only 42 percent of wives with high school diplomas were married to men with the same level of education.

The phenomenon is happening at the top of the education distribution, too. In 2005, 43 percent of wives with college degrees were married to men who also had college degrees. In 1960, the share was 33 percent.
What are the effects of this increased marital sorting? For one thing, it contributes to income inequality. If marriages occurred randomly across educational categories, Greenwood and his co-authors show, the Gini coefficient for household income in the U.S. in 2005 would decline to 0.34 from 0.43. (The coefficient falls as inequality decreases.) That would more than offset the entire increase in inequality that has occurred since the late 1960s. (This comparison is not entirely fair because even in the late 1960s, some assortative mating occurred. Nonetheless, it shows how large the effect is.)...MORE
Oddly enough at the exact second this came to my attention I was trying to find an enhanced GINI coefficient.
Possibly related:
Assortive Mating, Janet Yellen and O-Rings

Natural Gas: Goldfinch Capital Notches 21% in January on Natty Bets

$5.1920 last, off a bit from the $5.5260 of this morning's post.
It's enough to wear one out.
From Moneybeat:
Houston-based hedge fund Goldfinch Capital Advisors scored a nearly 21% gain last month amid an extraordinary wave of volatility in the natural gas market, according to people familiar with the matter.
The fund, one of the biggest money managers in the natural-gas market, has about $600 million in assets once the January gains are factored in, these people said.

Goldfinch is run by Michael Maggi, who once worked for billionaire Houston gas trader John Arnold at his former firm, Centaurus Energy. Mr. Arnold closed the firm in 2012, and several former colleagues launched new funds and raised hundreds of millions from investors.

Natural gas prices have seen some of their biggest price swings in years in the last month, as record-cold temperatures settled in across much of the country, driving up demand for the heating fuel. Futures rocketed up 10.4% on Jan. 29, plunged 8.3% the next day, then shot up 9.6% on Tuesday. Futures are up 26% this year, trading recently at $5.325 per million British thermal units.

Goldfinch was believed to be bullish on winter gas prices, the people familiar with the fund’s results said....MORE
What's not to love (look at that right side. those are monthly swings on a daily chart.)

Arrrgh--Updated--Journalism: BuzzFeed Releases Internal Style Guide--Updated

I forgot the link. Well you can guess what the fancy style guide says about that.
LINK>>> www.buzzfeed.com/emmyf/buzzfeed-style-guide
Original post:
I don't care what it says, I'm spelling it 'Fanboi'.
From BuzzFeed:
The BuzzFeed Style Guide aims to provide a prevailing, and evolving, set of standards for the internet and social media

BuzzFeed publishes news and entertainment in the language of the web, and in our work we rely on a style guide to govern everything from hard-hitting journalism to fun quizzes. We value consistency and accuracy across those formats and categories. (For instance, knowing how to treat numbers is important, but so is correctly spelling “fangirl.”) Our perspective reflects that of the internet at large, which is why we hope other sites and organizations across the web will find these guidelines useful. This style guide will be updated regularly to ensure it remains relevant and responds accordingly to changes in language and common, casual usage.

BuzzFeed’s preferred dictionary is Merriam Webster’s Collegiate Dictionary, 11th Edition (m-w.com). In Webster’s, the first spelling of a word should generally be used (unless it appears in the word list below or is preferred by The Associated Press Stylebook). The preferred style manual is the AP Stylebook. Please consult Chicago Manual of Style for issues not covered by AP Stylebook as well as for more detailed information and discussion, where applicable. Any style point mentioned in this guide overrules those publications.

This style guide provides a reference to common words and terms used on BuzzFeed (see: Word List) and information on style issues particular to the site. It is not intended to be a comprehensive manual of grammar and style.

Word List

?! (never !?)
@replies, @mentions (on Twitter)
24/7
3D
7-Eleven
A-list, B-list (etc., when referring to an “A-list celeb”)
ABCs
Abdel-Fattah al-Sisi
AC (for air-conditioning)
administration (lowercase “a” in political terms, e.g., “It has been something the administration has avoided” or “the Obama administration”)
adviser
after-party...
...MUCH MORE

There's a Reason It's Called GLOBAL Macro: 3D Printing--Belgium's Materialise Buys Poland's Leading Rapid Prototyping Co.

The acquiree, e-Prototypy, is into laser sintering, as are Sweden's Arcam and Germany's EOS.

Arcam, down 10% today, is up 1500% since we first noted it in September 2012. $10.28 to a split adjusted $150. Europe is more serious about the metalworking end of the 3D biz rather than the "Makerfaire" stuff.

See also the post immediately below for interconnections in global macro:
European Banks Have Loaned Almost $3 Trillion to Emerging Markets

From 3Ders.org:

Materialise acquires leading Polish prototyping center, e-Prototypy 
Belgian 3D printing company Materialise announces today the acquisition of e-Prototypy, Poland's leading provider of rapid prototypes and 3D Printing.

e-Prototypy offers a broad range of 3D printing solutions, with a specialization in the production of laser sintered components, and has invested in scanning and reverse engineering services in recent years. e-Prototypy has been active in the Polish market since 2008 and has grown to become the market leader in this region.
Materialise has been a market leader in the Czech market, through its subsidiary in Usti Nad Labem CR, since 2004. "With the acquisition of e-Prototypy, Materialise shows its commitment to further invest in the east-European market", says Bart Van Der Schueren, Vice President Industrial Production, Materialise. "Thanks to the acquisition, Polish customers will be gaining access to the vast production capacity of Materialise. Furthermore, current Materialise customers will benefit from access to the scanning and reverse engineering services of e-Prototypy."

"We see a lot of opportunities for growth in the Polish market and by joining Materialise. As part of Materialise, our customers will be given access to even better service with a larger range of 3D Printing technologies and they can benefit from Materialise's 23 years of experience in this industry", says Grzegorz Sworobowicz, vice-CEO and co-founder of e-Prototypy.
Both Materialise and EOS are private although the former is said to be considering an IPO. 

European Banks Have Loaned Almost $3 Trillion to Emerging Markets

Holy crap!
And here I am thinking smugly, we've no exposure to EM. We do to Europe but not EM. No sir.
As they say, you sleep with someone and you are actually sleeping with everyone they've ever slept with.
From ZeroHedge:
The $3 Trillion Hole - Why EM Matters To European Banks
How many times in the last few days have we been told that Turkey - or Ukraine or Venezuela or Argentina - are too small to matter? How many comparisons of Emerging Market GDP to world GDP to instill confidence that a little crisis there can't possible mean problems here. Putting aside this entirely disingenuous perspective, historical examples such as LTCM, and ignoring the massive leverage in the system, there is a simple reason why Emerging Markets matter. As Reuters reports, European banks have loaned in excess of $3 trillion to emerging markets, more than four times US lenders - especially when average NPLs for historical EM shocks is over 40%.

The risk is most acute for six European banks - BBVA, Erste Bank, HSBC, Santander, Standard Chartered, and UniCredit

As Reuters notes,
European banks have loaned in excess of $3 trillion (1.83 trillion pounds) to emerging markets, more than four times U.S. lenders and putting them at greater risk if financial market turmoil in countries such as Turkey, Brazil, India and South Africa intensifies.
...  
But the exposure could be a headache for the industry as a whole, just as it faces a rigorous health-check by the European Central Bank, aiming to expose weak points and restore investor confidence in the wake of the 2008 financial crisis.

"We think EM (emerging markets) shocks are a real concern for 2014," said Matt Spick, analyst at Deutsche Bank. "When currency (volatility) combines with revenue slowdowns and rising bad debts, we see compounding threats to the exposed banks." 
... 
An emerging markets crisis could hit banks in a variety of ways - a collapse in local currency can hurt reported earnings or capital held in the country; loan losses can jump as interest rates rise; or income from capital markets activity or private banking can fall.
...MORE

Schwab's Sonders: "Technical Pressure Is Weighing on Stocks"

Liz Ann is sharp. (see: reinforcement theory)
Tuesday the S&P closed at 1,755.20 and looks to give up a nickel at the opening.
From Barron's Wall Street's Best Minds column:

The charts and investor sentiment suggest that indexes have further to fall, writes a Charles Schwab pro. 
 By LIZ ANN SONDERS

Here are some key points.

•For now, the emerging-markets tail is wagging the dog, but the U.S. remains the world's big dog and should ultimately get through the latest turmoil.
•The so-called "January Barometer" has sent mixed signals for the remainder of the year historically.
•More technical and sentiment recovery is likely needed before a market recovery is likely.

The United States has always been the big dog … the one that typically wags the tail. So far this year though, emerging markets (EMs) are the tail that is wagging the dog. The obvious question is how much longer … the answer is less obvious.

As most readers know we've been alerting investors of the likelihood of a correction since late last year; largely due to the frothy sentiment conditions that accompanied a stellar year in 2013 and the beginning of monetary policy normalization via the Federal Reserve's tapering of quantitative easing (QE).

We have also noted that the next "crisis" was more likely to occur in the emerging markets than in the United States. As for whether EM turmoil will knock the US market fully off its rails, read on.
As January goes, so goes the year?

Let's start with the so-called January Barometer. Since the inception of the S&P 500 in 1928, there have been 31 down Januarys, with an average decline of 3.9%. About 58% of the time, the market went on to post a negative year, with an average decline of 13.8%. Narrowing the analysis down to the post-WWII era; since 1950, there have been 24 down Januarys, with an average decline of 3.9%. About 54% of the time, the market went on to post a negative year, with an average decline of 14.9%.

Of course, there were exceptions. For the negative Januarys that were associated with up years, the average gains were 13.6% since 1928 and 8.9% since 1950. In fact, the most recent occurrence of a negative January was 2009; during which the S&P posted a 23.5% gain for the full year. (Thanks to Ed Yardeni for this data.)

Technical damage … more likely to come

A lot of attention has also been devoted to the breach by the S&P 500 of its 50-day moving average) on January 24. It had been three months since it last closed below that level. The potential good news is that more often than not, the break below has not been indicative of more serious correction.
According to Bespoke Investment Group, in the S&P 500's history there have been 62 occurrences of the index closing below its 50-day moving average after trading above it for the prior three months or more. The average returns over the subsequent week, month and three month periods are pretty strong: 0.48%, 1.66%, and 3.21%, respectively.

Looking at the more recent past 30 years, there have been 23 instances when the 50-day moving average was crossed after at least three months of closes above it.

The average gains for the subsequent one week, one month and three months are 1.03%, 2.95% and 3.97%, respectively. Over this period, the market was up 65%, 74% and 83% of the time, respectively. Excluding the extreme outlier of 1987, the only three down periods over the following three month period in the past 30 years averaged a decline of only 0.76%.

Although I don't profess to wear a technician's hat very well, it does feel like we're at a greater risk this time of breaking down further and possibly testing (or breaking through) the S&P 500's 200 day moving average. That would take the decline to over 7% from its peak. If the market doesn't hold there, that would likely set the stage for a legitimate correction (defined as a drop of at least 10%)....MUCH MORE
My comment on Monday's drop, talking DJIA, This does not satisfy:
...Well the venerable index's decline added another 110 points from there and toward the end of the day there really was a stink of fear as a bottom note to the high-buck cologne. Additionally, this was too measured a decline for my jaded tastes. The day's chart looks like the slope of a bunny hill....
Reinforcement theory:
Reinforcement theory is a limited effects media model applicable within the realm of communication. The theory generally states that people seek out and remember information that provides cognitive support for their pre-existing attitudes and beliefs. The main assumption that guides this theory is that people do not like to be wrong and often feel uncomfortable when their beliefs are challenged....Wikipedia

"Natural Gas Retreats After Gains; CME Raises Margins for Trading"

You've probably noticed the dearth of posts on natty.
There's a reason for that, we don't want to lose any readers. The market is so whippy right now that I could be writing "Buy-Sell-Hold", "Short-Flat-Long" all day long and never get any work done. Plus, if anyone missed a single post they'd get wrong-footed, possibly lose money, get crabby and have to talk to the lady attorneys whose mellifluous voices may or may not bring them back into the readership.

And then the lady attorneys get mad at me because they should really be in Monaco for the end of the Primo Cup - Trophee Credit Suisse regatta and no they don't want to go to the Florida State Championship instead and I've wrecked their whole season and...arrrgh.

So yes we're very, very aware of what's going on in natural gas and if I can slip in something like Monday's "HAS NATURAL GAS PULLED BACK TO WHAT IS REAL SUPPORT?" at $4.84, within 60 minutes of tagging the $4.75 low mind you, reversing and hitting the current $5.5260 print, well yes, I'll do that but boy this is dangerous. See the chart at the CME.

Anyhoo, here's Bloomberg:
Natural gas retreated after yesterday surging the most in almost a week. CME Group Inc. raised margin requirements for trading the futures in New York to the highest level in more than four years amid increased price volatility.

Futures for March delivery fell as much as 2.3 percent to $5.252 per million British thermal units in electronic trading on the New York Mercantile Exchange and were at $5.354 at 10:24 a.m. London time. The contract rose 47 cents, or 9.6 percent, to settle at $5.375 yesterday, the biggest gain since Jan. 29.

The initial margin for next-month Henry Hub futures traded on Nymex will increase 9.9 percent to $5,500 for speculators from $5,005, effective after the close of business today, the operator of the exchange said in a notice yesterday. The new margin is the highest since October 2009, CME data show. Margin requirements have more than doubled from $2,530 on Jan. 3.

Gas futures are the most volatile commodity in the Standard & Poor’s GSCI gauge of 24 commodities. Volatility has jumped to 78.6 percent so far this year from 31.6 percent in 2013.

“Over the last four weeks historical volatility has more than doubled,” said Stephen Schork, president of Schork Group Inc., a consulting group in Villanova, Pennsylvania. “At the start of 2014, a 7 cent day-over-day move could be expected; today, a 22 cent move is the norm.”

Cold weather in the U.S. has helped fuel this year’s 26 percent gain in natural gas prices. MDA Weather Services predicted below-normal temperatures in most of the lower-48 U.S. states through Feb. 13. A winter storm will continue to move east today with heavy snow forecast from the Lower Great Lakes to New England and freezing rain for parts of the Northern Mid-Atlantic Coast to Southern New England, according to the U.S. National Weather Service....MORE
The futures turned higher after the above story was written, timestamped at 4:31 AM CT. Here's the action, and before you ask, the only thing I know is the $5.75-5.80 line from 2010 is as good an overhead resistance point as I can think of so we're close.
From FinViz:

Tuesday, February 4, 2014

"Why the Swiss are so good at banking"

From Next Bank:
I blogged a while ago about Switzerland and its origins as a financial centre, dating back to the Knights Templar.

After spending a couple of days in Switzerland, I found a fascinating book that sheds more light on the background to this small, but important, centre of private banking.  The book is called Swiss Made: The Untold Story Behind Switzerland's Success by R. James Breiding, and talks about the history of Switzerland’s commerce.

Why has Switzerland - a tiny, land-locked country with few natural advantages - become so successful for so long at so many things? In banking, pharmaceuticals, machinery, even textiles, Swiss companies rank alongside the biggest and most powerful global competitors. How did they get there?

I’m not going to repeat verbatim from the book, as I also discovered quite a lot of history of Switzerland myself whilst there, but thought it might be interesting to amalgamate some of these learnings from history to set the context of Switzerland’s success as a financial centre today.

It’s certainly a fascinating country with the origins of its strength in banking formed from the Knights Templar, who would look after pilgrims’ wealth whilst escorting them to the Holy Land.

After they settled in Switzerland in the 1300s, they became known as good hosts to negotiate trade and finance.

For example, during the Renaissance, the wool traders of Florence found that they could get around the laws of usury, banning interest on payments, by selling their goods in advance at a discount to the bankers of Geneva.  The difference in price was effectively a payment of interest.

This is recorded by the Bishop of Geneva, Adhemar Fabri, who permitted the city’s bankers to lend money in exchange for interest in 1387, ‘as long as [it was] held in reasonable restraint’.
The result was the Geneva became a key destination for European trade fairs, with exchange and credit granted as money was transferred between traders.

Swiss neutrality is also a key to its attraction as a financial centre.

Swiss neutrality dates back to the Reformation, and the divide between Catholic and Protestant interests.  In Switzerland, as the different cities and cantons split into factions, there were mammoth wars and warrior-style battles.

The Swiss were also known as the most prestigious military in the 15th century, bearing in mind that the country had been the settling place for the fierce legions of Knights Templar who survived the rout by the French King in 1307.  In fact, Swiss soldiers were much in demand by all the Kings of Europe, as well as leading to the long-standing tradition of the Swiss Guard at the Vatican.

Then the Reformation started.  Switzerland became torn in two thanks to the influence of Huldrych Zwingli, and eventually all of Europe became involved in the religious thirty years war.

What was interesting is that after Zwingli died in battle, his successor, Heinrich Bullinger, sought to achieve strength through the pen, rather than the sword....MORE
Also at Next Bank:
Don’t tell mum I work for a bank … she thinks I’m a pianoplayer in a whorehouse!

The Dream of Next-Gen Batteries All Hangs On an Apple Watch

The most intractable problem in tech. As is also true in the fusion energy biz "We're just ten years away from a breakthrough"
For the last fifty years.

From Motherboard:

Image: screenshot, iOS 7
Compared to often-dizzying pace of evolution in many areas of consumer electronics, there haven't been many leaps and bounds in the advancement of modern batteries in recent years. They're still expensive, toxic, and never seem to offer up as much juice as we want them to. And while industry luminaries like Google's Larry Page might dream of a day when devices don't need to be plugged in at all, the actual gadgets we own and use every day can't be powered on dreams alone.

Over the weekend, the New York Times offered up a juicy report about advances in battery technology that's giving many tech critics pause. Mostly this is because of the figure behind this new technology: Apple. The company that's been known to create or obliterate entire segments of the consumer electronic market with a flick of its wrist is now toying with several different ideas for charging its much-discussed-but-never-confirmed wearable "iWatch." And so even though its existence is still up for debate, the "iWatch" is already expected to disrupt the entire battery ecosystem in profound ways.

Whether its crushed silicon tripling battery life or sulfur-based batteries quadrupling it, battery breakthroughs are perennially on the horizon. The problem is that, even if battery yarn or a pee-powered battery is theoretically possible, making them cheap and durable enough to replace the lithium-ion polymer batteries we all rely on has yet to happen. Now, Apple is apparently solving the battery problem by instead working on alternative charging methods....MORE

Chartology: Citi on the 10-year Yield

Following up on "Interest Rates Are Still Heading Lower".
From ZeroHedge:

... US 10 year yield – closed below the 200 day moving average

The close below the 200 day moving average opens the way for a move to the double top neckline at 2.47%
Decent support levels come in just below there at 2.39%-2.41% which would have to be watched on a weekly close basis before confirming any medium term break (and in conjunction with US 30 year yields)
For now a test of 2.47% is expected in the short term...
ZH has more of Citi's FX team's technicals.

"Interest Rates Are Still Heading Lower"

The thing that stands out for me is the fact that although the 10-year yield is down from 3.040% i.e. the dollar amount of interest received is lower by 13.68%, the price of gold via the SPDR Gold ETF is only up 5.3% from its $114.46 low.
10-year yield 2.6240% up 0.0430.
From All Star Charts:
One of my favorite themes coming into the new year was how the market would react to lower interest rates. I couldn’t think of a single person who didn’t “know” that rates were heading higher. It was just assumed that we were in a higher interest rate environment. Extremes like this in sentiment make the best trades.

Now that we’re in February and interest rates have gotten crushed as bonds exploded higher, we hear and read about how unexpected this was. This is the common reaction to an unwind in extreme sentiment. Readers here know we were all over this trade (see here here here & here) but there seems to still more coming. I really don’t think this drop in rates is over.

These unwinds in sentiment can last longer and take prices further than most expect. In fact, I often see these unwinds ignore what would traditionally serve as reliable support and resistance levels. Sentiment can be that powerful when the masses are on completely the wrong side of the trade, which is precisely what we had here.

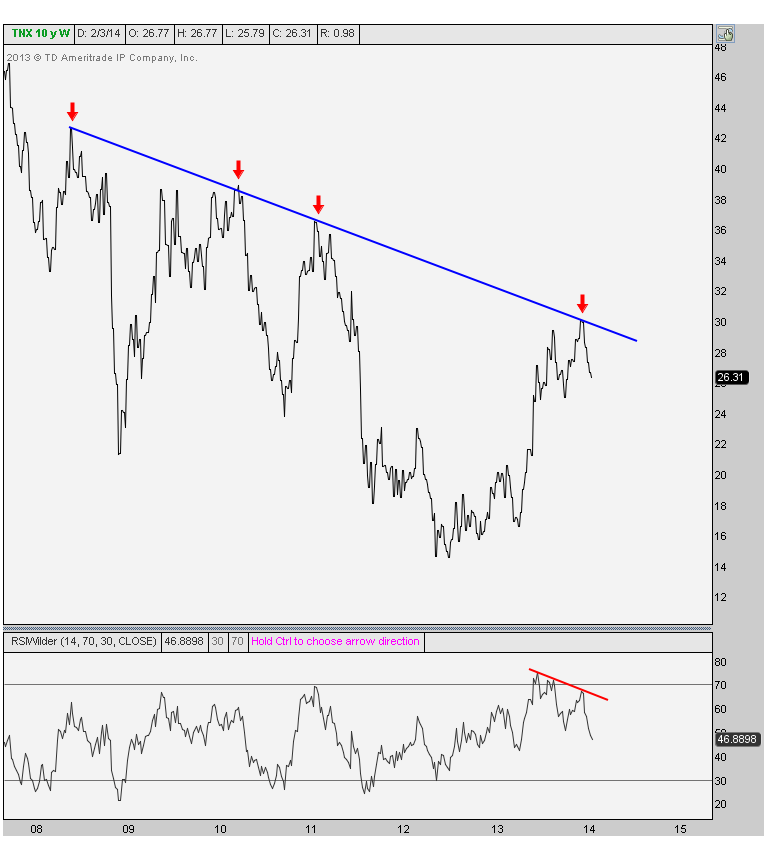
But let’s put that aside for a minute. Price, at the end of the day is the only thing that pays us. Extreme sentiment unwind or not, price still rules in our world. So here is the weekly chart that we were first pointing to when we caught the bond bears napping.
2-4-14 TNX weekly line
Every time rates get up to this down trend line they seem to roll over pretty hard. In fact, every time rates have hit this level, on average they get cut in half. I’m not predicting that this will absolutely occur once again, but a 10yr yield back down to 1.5% would be perfectly normal....MORE
See also Jan. 21's:
Chartology: Yields Lower, Then Higher (in line With DoubleLine's Jeff Gundlach)
He is calling for an initial move to 2.5% on the 10 year but doesn't forecast the subsequent upmove.  

If Your Choice Is Vice or the S&P 500, Bet on Vice

In yesterday's "SSRN Paper: 'Time-Varying Fund Manager Skill'" I promised we'd be coming back to Imperial College London's Professor Marcin Kacperczyk. Professor K, along with Princeton's Harrison Hong wrote a paper which we noted in a 2007 post "Moral Judgment On 'Sin Stocks' Means Higher Returns For Vice-Friendly Investors".

The paper "The Price of Sin: The Effects of Social Norms on Markets" is available here.
The thing that stands out is, if you use the VICEX mutual fund (1.37% annual expense) as a proxy for the tobacco, alcohol and war businesses, how reliably sin outperforms.

Here are the 6-month, 1-year, 2-year 5-year and 10-year charts vs. the S&P, via Yahoo Finance:

Six Month
Chart forVice Investor (VICEX)
One Year
Chart forVice (VICEX)
Two Year 
Chart forVice Investor (VICEX)
Five Year
Chart forVice Investor (VICEX)
Ten Year
 Chart forVice Investor (VICEX)

Just amazing that an anomaly should be so persistent.
I can't wait til they put the marijuana mavens in there.
And sexbots.
Get the whole country blissed out and the fund goes to infinity.Who needs Soma?
Here are the funds' holdings.

"the warm, the richly coloured, the infinitely friendly world of soma-holiday. 
How kind, how good-looking, how delightfully amusing every one was! "
-Aldous Huxley, Brave New World

An Apology to ZeroHedge

From Cassandra Does Tokyo:
ZeroHedge
Enigma House
1 Underabigrockov Square
Sofia
Bulgaria
 

RE: An Apology


Dear ZeroHedge,

I am sorry. Evidently, I was wrong about conspiracy, more specifically, the US Government's pursuit of what must be one of, if not THE world's biggest: the hoovering-up (no pun intended) storage and analysis of the entire world's digital and voice information. In the past, I derided your cherished belief in a US Government Puppeteer-like Plunge-Protection Team on the Ockham-inspired grounds that it would be virtually impossible to undertake what was alleged without at least some whistle-blowers, co-conspirators and/or enablers coming forward with evidence to expose such actions. I was quick to point out the glaring inconsistency to your argument that mocked what you saw as the US Government's apparent ineptitude in Agriculture, Healthcare, Securities Market regulation, Welfare, Military Purchasing, Industrial Policy, FEMA, as well as Fiscal and Monetary policies, yet somehow managed to confer an ability to implement and perpetuate Machiavellian manipulations and direct interventions in financial markets to great success (and to the chagrin of perma-bears and pessimists alike) without ever getting get caught.

...
...MUCH MORE

Aon's Terrorism and Political Violence Risk Map 2014

Via RiskAdvisory:

Risk Advisory collaborates with Aon on 2014 Terrorism & Political Violence Map

Risk Advisory collaborates with Aon on 2014 Terrorism & Political Violence Map

And AON:
 
Map Format Options Note: Political Risk Map and Terrorism Risk Map are hosted on the same website. Use the same login credentials to access both.
Click the links below to access:
PDF Version
Online Version for 2014 Data Only (no registration required)
Login to Online Historical Maps (if you already registered)
Complete and submit the form below to register for Online Historical Maps.

"The Citi-Imperial Digital Money Readiness Index"

From Irving Wladawsky-Berger:
On January 29 I attended the 2014 Digital Money Symposium in London, co-sponsored by Citi and Imperial College.  The Symposium convened a group of leaders in their fields to explore the state of adoption of digital money and its economic and societal impacts around the world.  This is the second such Digital Money Symposium, the first one having taken place in London in January of 2013. 
I was a part of the Citi-Imperial team that organized the event.  For this year’s Symposium, we developed a framework that would enable us to discuss the state of adoption of digital money on a more data-driven, scientific basis.  We looked at digital money as a highly complex sociotechnical ecosystem, that is, a technology-intensive system that has major societal, economic and political implications, like cities, healthcare and education.  To help us begin to quantify and understand this ecosystem, we developed the Digital Money Readiness Index, a set of global metrics that enables us to link digital money adoption to various measures of socio-economic development. 
The Index is a multi-functional tool, encompassing publicly available data from 90 countries around the world.  By analyzing its various interdependent components, the team computed a measure of how ready a country is to adopt digital money.  Quantifying the progress being made by each country along the digital money roadmap should help understand the key obstacles the country faces, as well as the potential actions it could take to overcome them.
Overall, the Index aims to help answer two fundamental sets of questions: 
What Matters?: What factors affect the adoption of digital money around world, and how do they vary across different countries and regions? 
 Why Bother?: Does digital money adoption really make a difference, and if so, can we quantify the benefit to governments, companies and individuals?
The initial answers to these questions are described in Getting Ready for Digital Money: A Roadmap, a report developed by the Citi-Imperial team for the 2014 Symposium.
The Readiness Index is composed of four key pillars: 
  • Institutional Environment, a measure of the institutional conditions enabling digital money adoption, including property rights, market efficiency, regulatory quality, R&D spending and patents. 
  • Enabling Infrastructure, which measures the technological and financial infrastructure needed to support digital money, including availability and affordability of financial services, financial regulation, and ICT infrastructure and skills. 
  • Solution Provisioning, consisting of the industries and functions driving digital money solutions, including electronic payments, e-commerce and e-government. 
  • Propensity to Adopt, which captures the extent to which consumers and businesses embrace digital innovation, including ICT usage, technology diffusion rates, quality of business sophistication and perceived corruption. 
Using these various indicators, a readiness score was computed for each of the 90 countries in the study.  Based on their scores, the countries were then clustered into 4 major readiness groups: 
  • Incipient (30 countries): Limited ICT and financial services are available to the majority of the population. 
  • Emerging (20 countries): These countries have basic ICT infrastructures, financial services and regulatory regimes.  However, they are challenged by a number of factors, including a sizable informal economy, limited enforcement of existing regulations, lack of ICT beyond urban centers, and consumer preference for cash. 
  • In-Transition (20 countries): These countries have overcome most of the challenges of the earlier stages, but they are behind in some of the more advanced digital payment solutions, including e-commerce and transit. 
  • Materially Ready (20 countries): ICT infrastructures and digital solutions are ubiquitous.  The regulatory environment encourages private sector investment and innovation in new digital solutions.  But there is still a need to continue the development of the digital money ecosystem and to drive toward its near-universal adoption. 
Each country has its own unique history and culture, so its progress along the readiness roadmap must be tailored to its unique circumstances.  The Roadmap report includes a few such concrete examples.  But, an analysis of the data at each stage reveals the most likely bottlenecks whose resolutions will increase the likelihood that a country will transition to the next readiness stage....
...MUCH MORE

Alternative Futures For the S&P 500

The index is at 1748.01 up 6.12. Our 1775 guess as a bottom got totally blown out yesterday.

Have you ever noticed how 'sanguine' and 'sanguinary' have the same Latin root, sanguineus, but mean such different things?

The first is defined as "optimistic or positive, esp. in an apparently bad or difficult situation" whereas the latter is "involving or causing much bloodshed".

See also: "Delusional analyst".
Anyhoo.

Here's a guy who's not delusional and a keeper of the link to the Cowles Commission database to boot, Political Calculations:
Lots of analysts spend a lot of time trying to determine what the future expectations are for future earnings that investors have as they make investment decisions today as they set stock prices. For us, we already know what investors expect for what future earnings (or really, dividends) that they can reasonably expect to earn in each of the future quarters through the end of 2014, but the real challenge is determining how far in the future they're looking, because the expectations for just one of these future quarters will be the primary driver for stock prices.

To that end, we're going to re-do our previous "what-if" exercise from last week, where we only presented how stock prices might reasonably behave during the month of February if investors maintained their focus on 2013-Q2 in setting their expectations, to also show what a focus on either 2014-Q3 or 2014-Q4 would mean for the S&P 500.Alternative Futures: What Investors Focusing on Different Future Quarters in Setting Expectations Means for the S&P 500, as of 29 January 2014
Welcome to our world, where we're always working in one of several alternative futures....

...MORE

"Meet China’s Biggest Shadow Bank"

From The Peterson Institute...:
Shadow banks in China come in a variety of forms and guises. The term is applied to everything from trust companies and wealth management products to pawnshops and underground lenders. What surprising is that China’s biggest shadow bank is actually a creation of the central government and receives billions in financing directly from the banks.  Even more interesting, this shadow bank recently pulled off a successful international IPO where it raised billions of dollars.

First, let’s deal with the terminology. The “shadow” in shadow banking doesn’t imply nefarious doings, although it frequently involves a bit of regulatory arbitrage. At the most basic level, shadow banking is borrowing funds and extending credit outside of normal banking structures.

So what is this mysterious shadow bank that has such tight government connections? It’s none other than Cinda Asset Management Company, a creation of the Ministry of Finance (MoF) and the beneficiary of a recent 2.5 billion U.S. dollar IPO in Hong Kong.  In terms of total assets, Cinda is more than 15 times as large as any of the country’s trust companies.

The normal business of a distressed asset management company (AMC) is not shadow banking. It involves purchasing troubled loans at a discount and trying to collect a higher amount from the debtors. Cinda was one of the four AMC’s created by the central government to bailout the banking sector in the 1990s. The initial round of bad debt purchasing was policy-directed, starting in the late 1990s and lasting through the mid-2000s. In the second half of the 2000s, the big four AMCs began to purchase NPLs from banks on commercial terms and in the process tried to transform themselves into market-oriented businesses.

Over the last three and a half years, Cinda’s business has diverged from this model. In addition to purchasing bad debts from banks and other financial institutions, it has accumulated a vast stock of distressed debt assets directly from non-financial corporations.
Net Balance of DA
These non-financial enterprises distressed assets (NFEs) include overdue receivables, receivables expected to be overdue, and receivables from corporates with liquidity issues. In effect, Cinda has become a huge source of financing for companies facing financial distress.

It comes as no surprise that real estate developers have been the primary recipient of this emergency funding. Squeezed by central government efforts to dampen the housing boom, real estate developers are frequently cut off from formal bank loans.  As is the case with the growth of shadow banking in other parts of the financial system, Cinda has found a way to circumvent these restrictions by offering credit to property developers through the NFE channel. The Cinda IPO prospectus states that 60 percent of distressed receivables are attributable to the real estate sector.

What makes the whole situation a bit dubious is that Cinda has financed these purchases through a massive borrowing spree at below market rates. Over the last 3.5 years, the size of CINDA’s borrowings increased 13x, while the interest on these borrowings has fallen dramatically (paid interest was less than three percent). Despite the claim from the IPO prospectus that the borrowing was primarily from “market-oriented sources,” it seems unlikely that any market-oriented actor would loan out funds at a rate significantly below inflation and less than half of the benchmark lending rate....MORE
HT: The FT's beyondbrics' Further Reading post.

Meanwhile, On CNN

Meanwhile on @CNN… 
Meanwhile on @CNN… 

From Party Like a Journalist