Friday, August 28, 2020

Gamification: It's Definitely Not Fun and Games

From Real Life Magazine, August 27:

The Gamification of Games
When play becomes chiefly about data collection
Despite its name, gamification has never really been about making experiences more game-like. If there were a common characteristic that defined all games, it would certainly not be the use of badges, achievements, and points as incentives for engagement. Games, if anything, share an embodiment of the spirit of play — a temporary suspension of the rules of life to make space for intensities of experience: levity, rivalry, concentration, joy. If historian Johan Huizinga — whose 1938 book Homo Ludens is one of the pivotal works of game studies — had the opportunity to define gamification according to his theory of play, he might have reserved the term for a “temporary abolition of the ordinary world” where “inside the circle of the game the laws and customs of ordinary life no longer count.”

Now gamification evangelists like Jane McGonigal advocate for games to be understood as fundamentally productive, offering a set of tactics to make life under neoliberalism appear more fun and addictive — a “magic circle” we should never step out from, even if we had the choice. The concept first gained traction at the end of the 2000s within game development and marketing communities, which saw an opportunity to use aspects of games to monetize the web. In 2008, before the word had a standardized spelling, a blog explained “gameification”  as “taking game mechanics and applying [them] to other web properties to increase engagement.” In the Wharton School of Business’s popular online course titled Gamification, the instructor professes that “there are some game elements that are more common than others and that are more influential than others in shaping typical examples of gamification.” These elements are “points, badges, and leaderboards.” These offer scores that constitute “a universal currency, if you will, that allows us to create a system where doing one sort of action, going off on a quest with your friends, is somehow equivalent or comparable to doing some other sort of action, sitting and watching a video on the site.”

Many games have scores, of course, but typically they serve the limited purpose of determining a winner of a particular contest. Gamification takes scores as an exportable measure of qualities that are no longer internal to the game that has generated them. “Score” becomes just another word for data — a “universal equivalent” whereby life activity and behavior can be reckoned with in quantified terms. From this perspective, games are primarily a means of data production, not a more intense or rewarding form of experience. Accordingly, apps that convert activity into points are hardly concerned with improving the quality of engagement, nor are they limited to the task of encouraging it. Consider the data collection practices of prominent gamification apps such as Nike’s fitness tracker Nike+, the productivity role playing game Habitica, or the language training app Duolingo. Gamification gurus praise these apps for how they import game mechanics, while watchdogs condemn them for privacy violations....
....MUCH MORE

"The Big Tech Extortion Racket" (GOOG; AMZN; FB)

The author of this piece caused a bit of a contretemps a few years ago that the reader may recall. From his Wikipedia mini-bio:
Barry C. Lynn is a liberal American journalist and writer. He was a senior fellow at the New America Foundation think tank in Washington, D.C., directing the Open Markets Program. The program was shut down, allegedly for criticizing Google, one of New America's chief funders.[1] He has written extensively on globalization, economics, and politics for such publications ranging from The Financial Times and Forbes to Mother Jones and the Harvard Business Review.[2]
And from Harper's Magazine, September 2020 a superb piece:

How Google, Amazon, and Facebook control our lives 
Popular histories present the Boston Tea Party as a rebellion against taxes. Yet what the colonists objected to more than anything was the idea of an all-powerful corporate middleman regulating commerce. They viewed the 1773 protest in Boston Harbor as a victory for liberty and a blow against the British East India Company’s trade monopoly.

That corporation owed its dominance not to any proprietary advantage but to an exclusive British government charter. The artificial nature of this power was made clear soon after the Congress of the new United States signed a peace treaty with Britain. Six weeks later, the American ship Empress of China sailed from New York, bound for Canton. When the ship returned, its traders sold tea and porcelain on the open market. Without the active backing of the British state, the East India Company could not stop the sale—let alone determine who sold what, or where and how they sold it, in America.

But around the middle of the nineteenth century, Americans began to develop technologies that could not be broken into component pieces. This was especially true of the railroad and the telegraph. These expensive and complex networks were built across vast areas of land and required large teams of people to operate. This made the earlier solution to monopolies—dissolution—impossible. If Americans planned to take full advantage of these technological advances, they would have to regulate the actions of the corporations that controlled them.

Such corporations posed one overarching challenge: they charged some people more than others to get to market. They exploited their control over an essential service in order to extort money, and sometimes political favors. The system of “discriminations made between individuals . . . is the most serious evil connected with our present methods of railroad management,” the Yale professor Arthur T. Hadley explained in 1885. “Differences are made which are sufficient to cripple all smaller competitors. . .  and concentrate industry in a few hands.”

Americans found the answer to this problem in common law. For centuries, the owners of ferries, stagecoaches, and inns had been required to serve all customers for the same price and in the order in which they arrived. In the late nineteenth century, versions of such “common carrier” rules were applied to the new middleman corporations.

Today we rightly celebrate the Sherman Antitrust Act of 1890, which gave Americans the power to break apart private corporations. But in many respects, the Interstate Commerce Act of 1887 was the more important document. This act was based on the understanding that monopoly networks like the railroad and the telegraph could be used to influence the actions of people who depend on them, and hence their power must be carefully restricted, in much the same way that we restrict the power of government. As Senator Sherman himself put it,
It is the right of every man to work, labor, and produce in any lawful vocation and to transport his production on equal terms and conditions and under like circumstances. This is industrial liberty, and lies at the foundation of the equality of all rights and privileges.
For a century and a half, Americans used common carrier policies to ensure the rule of law in activities that depended on privately held monopolies. These rules served as a pillar of American prosperity through much of the twentieth century. By neutralizing the power of all essential transport and communications systems, the regulations freed Americans to take full advantage of every important network technology introduced during these years, including telephones, water and electrical services, energy pipelines, and even large, logistics-powered retailers. Citizens did not have to worry that the men who controlled the technologies involved would exploit their middleman position to steal other people’s business or disrupt balances of power.

In the 1970s and 1980s, Robert Bork, Richard Posner, and other neoliberal Chicago School legal scholars set out to overturn America’s antimonopoly regime, targeting the traditional prohibitions on discrimination that common carrier laws had established. Their scholarship later played a major role in the writing of Section 230 of the Communications Decency Act of 1996. In that bill, Congress simultaneously exempted internet platforms from any responsibility to police the content on their sites, and failed entirely to impose on them any requirement to provide equal and just service to all who depend on their networks.

As a result, Amazon, Google, Facebook, and other platforms were free to develop business models that treated every seller and buyer—every citizen—differently. These corporations exploited this license to the fullest, and have used their power to reorganize entire realms of human activity. Amazon, Google, and Facebook match individuals to specific shoes and clothes, specific restaurants and hotels, specific movies and music, specific jobs and schools, specific drugs and hospitals, specific sexual partners, and even specific books, articles, speakers, and sources of news.
These companies are the most powerful middlemen in history. Each guards the gate to innumerable sources of essential information, services, and products. Yet thus far no governmental entity in the United States has signaled any intention of limiting the license these corporations enjoy to serve only the customers they choose to, at whatever price they decide.

This means that Jeff Bezos, Sergey Brin, Larry Page, and Mark Zuckerberg enjoy much the same power as God did in Babel. We live in the world they manufacture for us. Their vision for what we should do, where we should go, how we should think, and who we should be is now our vision, too. As their manipulation machines increasingly deliver different information to each member of the public, it becomes harder for people to engage in debate and have any chance at bringing these companies under control.
the manipulation of the seller
Traditionally, retailers operate by purchasing someone else’s product and reselling it to consumers. Amazon calls this its first-party business, and it remains a large driver of revenue. But as Bezos detailed in his 2018 letter to investors, Amazon in recent years has focused more on connecting companies that want to sell a particular product with people who want to buy that product, then charging a fee for this service. After noting that annual first-party sales had grown from $1.6 billion in 1999 to $117 billion in 2018, Bezos added that during that same period, third-party sales grew from $0.1 billion to $160 billion.

This new model was so successful, Bezos claimed, because Amazon had done such “a great job” of helping independent sellers “compete against” the company’s own business. Amazon, he wrote, adding his own italics, had provided other sellers with “the very best selling tools we could imagine and build.” “To put it bluntly,” he went on, adding more italics, “Third-party sellers are kicking our first party butt. Badly.”

But to the third-party sellers, the arrangement looks somewhat different. These companies sell on Amazon because there are few other places to find customers online. According to data collected last year, 66 percent of all online shoppers start their search on Amazon. Of those looking for a specific product, the figure is 74 percent. In short, when it comes to commerce in consumer goods, if you are not on Amazon, you are not really in the market....
....MUCH MORE 

Mad Scientist Blog: "Three Futurist Urban Scenarios"

This is stuff the U.S. Army pays people to think about.
And one thing they think about is the urban landscape.
Here are a couple of the scenarios, from the blog of the U.S. Army's Mad Scientist Laboratory, January 19, 2019:
[Editor’s Note: Mad Scientist welcomes back returning guest blogger Dr. Nir Buras with today’s post.  We’ve found crowdsourcing (i.e., the gathering of ideas, thoughts, and concepts from a widespread variety of interested individuals) to be a very effective tool in enabling us to diversify our thoughts and challenge our assumptions.  Dr. Buras’ post takes the results from one such crowdsourcing exercise and extrapolates three future urban scenarios.  Given The Army Vision‘s clarion call to “Focus training on high-intensity conflict, with emphasis on operating in dense urban terrain,” our readers would do well to consider how the Army would operate in each of Dr. Buras’ posited future scenarios…]
The challenges of the 21st century have been forecast and are well-known. In many ways we are already experiencing the future now. But predictions are hard to validate. A way around that is turning to slightly older predictions to illuminate the magnitude of the issues and the reality of their propositions.1 Futurists William E. Halal and Michael Marien’s predictions of 2011 have aged enough to be useful. In an improved version of the Delphi method, they iteratively built consensus among participants. Halal and Marien balanced the individual sense of over sixty well-qualified experts and thinkers representing a range of technologies with facilitated feedback from the others. They translated their implicit or tacit know how to make qualified quantitative empirical predictions.2
From their research we can transpose three future urban scenarios:  The High-Tech City, The Feral City, and Muddling Through.

The High-Tech City
The High-Tech City scenario is based primarily on futurist Jim Dator’s high-tech predictions. It envisions the continued growth of a technologically progressive, upwardly mobile, internationally dominant, science-guided, rich, leisure-filled, abundant, and liberal society. Widespread understanding of what works largely avoids energy shortages, climate change, and global conflict.3
The high-tech, digital megacity is envisaged as a Dubai on steroids. It is hyper-connected and energy-efficient, powered by self-sustaining, renewable resources and nuclear energy.4

Connected by subways and skyways, with skyscraping vertical gardens, the cities are ringed by elaborately managed green spaces and ecosystems. The city’s 50 to 150-story megastructures, “cities-in-buildings,” incorporate apartments, offices, schools and grocery stores, hospitals and shopping centers, sports facilities and cultural centers, gardens, and running tracks. Alongside them rise vertical farms housing animals and crops. The rooftop garden of the 2015 film High Rise depicts how aerial terraces up high provide a sense of suburban living in the high-tech city.5

On land, zero-emission driverless traffic zips about on intelligent highways. High-speed trains glide silently by. After dark, spider bots and snake drones automatically inspect and repair buildings and infrastructure.6
In the air, helicopters, drones, and flying cars zoom around. Small drones, mimicking insects and birds, and programmable nano-chips, some as small as “smart” dust, swarm over the city into any object or shape on command. To avoid surface traffic, inconvenience, and crime, wealthier residents fly everywhere.7

Dominated by centralized government and private sector bureaucracies wielding AI, these self-constructing robotic “cyburgs” have massive technology, robotics, and nanotechnology embedded in every aspect of their life, powered by mammoth fusion energy plants.8
Every unit of every component is embedded with at least one flea-size chip. Connected into a single worldwide digital network, trillions of sensors monitor countless parameters for the city and everything in it. The ruling AI, commanded directly by individual minds, autonomously creates, edits, and implements software, simultaneously processing feedback from a global network of sensors.9
https://madsciblog.tradoc.army.mil/wp-content/uploads/2019/01/3FUS-4a.jpg
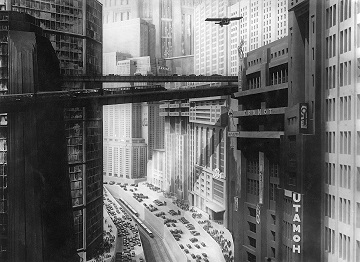
Metropolis by Fritz Lang was the first film to show a city 
of  the future as a modernist dystopia. / Produced by Ufa.
The High-Tech City is not a new concept. It goes back to Jules Verne, H. G. Wells, and Fritz Lang, who most inspired its urban look in the 1927 film Metropolis. The extrapolated growth of technology has long been the basis for predictions. But professional futurists surprisingly agree that a High-Tech Jetsons scenario has only a 0%-5% probability of being realized.10
Poignantly, the early predictors transmitted a message that the stressful lifestyle of the
High-Tech City contradicts the intention of freedom from drudge. Moreover, the High-Tech megacities’ appetite for minerals may lay waste to whole ecosystems. Much of the earth may become a feral wilderness. Massive, centralized AI Internet clouds and distribution systems give a false sense of cultural robustness. People become redundant and democracy meaningless. The world may fail to react to accelerated global crises, with disastrous consequences. The paradoxical obsolescence of high-tech could slide humanity into a new Dark Age.11

The Feral City
Futurists disturbingly describe a Decline to Disaster scenario as five times more likely to happen than the high-tech one. From Tainter’s theory of collapse and Jane Jacobs’s Dark Age Ahead we learn that the cycles of urban problem-solving lead to more problems and ultimately failures. If Murphy’s Law kicks in, futurists predict a 60% chance that large parts of the world may be plunged into an Armageddon-type techno-dystopian scenario, typified by the films Mad Max (1979) and Blade Runner (1982).12
Apocalyptic feral cities, once vital components in national economies, are routinely imagined as vast, sprawling urban environments defined by blighted buildings. An immense petri dish of both ancient and new diseases, rule of law has long been replaced by gang anarchy and the only security available in them is attained through brute power.13
Neat suburban areas were long ago stripped for their raw materials. Daily life in feral cities is characterized by a ubiquitous specter of murder, bloodshed, and war, of the militarization of young men, and the constant threat of rape to females. Urban enclaves are separated by wild zones, fragmented habitats consisting of wild nature and subsistence agriculture. With minimal or no sanitation facilities, a complete absence of environmental controls, and massive populations, feral cities suffer from extreme air pollution from vehicles and the use of open fires and coal for cooking and heating. In effect toxic-waste dumps, these cities pollute vast stretches of land, poisoning coastal waters, watersheds, and river systems throughout their hinterlands.14
Pollution is exported outside the enclaves, where the practices of the desperately poor, and the extraction of resources for the wealthy, induce extreme environmental deterioration. Rivers flow with human waste and leached chemicals from mining, contaminating much of the soil on their banks.15
Globally connected, a feral city might possess a modicum of commercial linkages, and some of its inhabitants might have access to advanced communication and computing. In some areas, agriculture might forcefully cultivate high-yield, GMO, and biomass crops. But secure long-distance travel nearly disappears, undertaken mostly by the super-rich and otherwise powerful.16

Futurists backcasting from 2050 say that the current urbanization of violence and war are harbingers of the feral city scenario. But feral cities have long been present. The Warsaw Ghetto in World War Two was among them, as were the Los Angeles’ Watts neighborhood in the 1960s and 1990s; Mogadishu in 2003, and Gaza repeatedly.17
Conflict and crime changed once charming, peaceful Aleppo, Bamako, Caracas, Erbil, Mosul, Tripoli, and Salvador into feral cities. Medieval San Gimignano was one. Spectacularly, from 1889 to 1994 the ghastly spaces of Hong Kong’s singular urban phenomenon, the Walled City of Kowloon, provided a living example.18
...MORE

"Feral Cities"

Sticking with the urban environment.
From the U.S. Naval War College Review (2003):
Imagine a great metropolis covering hundreds of square miles. Once a vital component in a national economy, this sprawling urban environment is now a vast collection of blighted buildings, an immense petri dish of both ancient and new diseases, a territory where the rule of law has long been replaced by near anarchy in which the only security available is that which is attained through brute power.

Such cities have been routinely imagined in apocalyptic movies and in certain science-fiction genres, where they are often portrayed as gigantic versions of T. S. Eliot’s Rat’s Alley. Yet this city would still be globally connected. It would possess at least a modicum of commercial linkages, and some of its inhabitants would have access to the world’s most modern communication and computing technologies. It would, in effect, be a feral city.

Admittedly, the very term “feral city” is both provocative and controversial.Yet this description has been chosen advisedly. The feral city may be a phenomenon that never takes place, yet its emergence should not be dismissed as impossible. The phrase also suggests, at least faintly, the nature of what may become one of the more difficult security challenges of the new century.

Over the past decade or so a great deal of scholarly attention has been paid to the phenomenon of failing states.3Nor has this pursuit been undertaken solely by the academic community. Government leaders and military commanders as well as directors of nongovernmental organizations and intergovernmental bodies have attempted to deal with faltering,failing, and failed states. Involvement by the United

States in such matters has run the gamut from expressions of concern to cautious humanitarian assistance to full-fledged military intervention. In contrast,however, there has been a significant lack of concern for the potential emergence of failed cities. This is somewhat surprising, as the feral city may prove as common a feature of the global landscape of the first decade of the twenty-first century as the faltering, failing, or failed state was in the last decade of the twentieth.While it may be premature to suggest that a truly feral city—with the possible exception of Mogadishu—can be found anywhere on the globe today, indicators point to a day, not so distant, when such examples will be easily found.

This article first seeks to define a feral city. It then describes such a city’s at-tributes and suggests why the issue is worth international attention. A possible methodology to identify cities that have the potential to become feral will then be presented. Finally, the potential impact of feral cities on the U.S. military, and the U.S. Navy specifically, will be discussed.

DEFINITION AND ATTRIBUTES
The putative “feral city” is (or would be) a metropolis with a population of more than a million people in a state the government of which has lost the ability to maintain the rule of law within the city’s boundaries yet remains a functioning actor in the greater international system.

In a feral city social services are all but nonexistent, and the vast majority of the city’s occupants have no access to even the most basic health or security assistance. There is no social safety net. Human security is for the most part a matter of individual initiative. Yet a feral city does not descend into complete,random chaos. Some elements, be they criminals, armed resistance groups, clans, tribes, or neighborhood associations, exert various degrees of control over portions of the city. Intercity, city-state, and even international commercial transactions occur, but corruption, avarice, and violence are their hallmarks. A feral city experiences massive levels of disease and creates enough pollution to qualify as an international environmental disaster zone. Most feral cities would suffer from massive urban hypertrophy, covering vast expanses of land. The city’s structures range from once-great buildings symbolic of state power to the meanest shantytowns and slums.
Yet even under these conditions, these cities continue to grow, and the majority of occupants do not voluntarily leave.

Feral cities would exert an almost magnetic influence on terrorist organizations. Such megalopolises will provide exceptionally safe havens for armed resistance groups, especially those having cultural affinity with at least one sizable segment of the city’s population. The efficacy and portability of the most modern computing and communication systems allow the activities of a worldwide terrorist, criminal, or predatory and corrupt commercial network to be coordinated and directed with equipment easily obtained on the open market and packed into a minivan.

The vast size of a feral city, with its buildings, other structures, and subterranean spaces, would offer nearly perfect protection from overhead sensors, whether satellites or unmanned aerial vehicles. The city’s population represents for such entities a ready source of recruits and a built-in intelligence network. Collecting human intelligence against them in this environment is likely to be a daunting task. Should the city contain airport or sea-port facilities, such an organization would be able to import and export a variety of items. The feral city environment will actually make it easier for an armed resistance group that does not already have connections with criminal organizations to make them. The linkage between such groups, once thought to be rather unlikely, is now so commonplace as to elicit no comment.

WHAT’S NEW?
But is not much of this true of certain troubled urban areas of today and of the past? It is certainly true that cities have long bred diseases. Criminal gangs have often held sway over vast stretches of urban landscape and slums; “projects” and shantytowns have long been part of the cityscape. Nor is urban pollution any-thing new—London was environmentally toxic in the 1960s. So what is different about “feral cities”?

The most notable difference is that where the police forces of the state have sometimes optednot to enforce the rule of law in certain urban localities, in a feral city these forces will not be able to do so.

Should the feral city be of special importance—for example, a major seaport or airport—the state might find it easier to negotiate power and profit-sharing arrangements with city power centers to ensure that facilities important to state survival continue to operate. For a weak state government, the ability of the feral city to resist the police forces of the state may make such negotiations the only option. In some countries, especially those facing massive development challenges, even the military would be unequal to imposing legal order on a feral city. In other, more developed states it might be possible to use military force to subdue a feral city, but the cost would be extremely high, and the operation would be more likely to leave behind a field of rubble than a reclaimed and functioning population center. Other forms of state control and influence in a feral city would also be weak,and to an unparalleled degree....
...MUCH MORE (11 page PDF)

Complexity: Travel Routes and the Organization of Cities

First posted in February 2018:
In January's "A conversation about how public transport really works" I mentioned:
My interest in transport planning is usually the financial angle,* maybe quasi-esoteric complexity stuff e.g. "Study on Fractal Features of Transportation Network in Xuzhou City". Or, transport planning as part of the wider discipline of urban planning (and anti-planning).

Contra that dilettante approach, in this piece the FT's Izabella Kaminska interviews an actual professional.

From FT Alphaville:...MORE
Here's one of those quasi-esoteric complexity thingies, from the journal, Nature, December 20, 2017:

Morphology of travel routes and the organization of cities
Abstract

The city is a complex system that evolves through its inherent social and economic interactions. Mediating the movements of people and resources, urban street networks offer a spatial footprint of these activities. Of particular interest is the interplay between street structure and its functional usage. Here, we study the shape of 472,040 spatiotemporally optimized travel routes in the 92 most populated cities in the world, finding that their collective morphology exhibits a directional bias influenced by the attractive (or repulsive) forces resulting from congestion, accessibility, and travel demand. To capture this, we develop a simple geometric measure, inness, that maps this force field. In particular, cities with common inness patterns cluster together in groups that are correlated with their putative stage of urban development as measured by a series of socio-economic and infrastructural indicators, suggesting a strong connection between urban development, increasing physical connectivity, and diversity of road hierarchies.
Introduction


The city is an archetype of a complex system, existing and evolving due to the myriad socio-economic activities of its inhabitants1,2,3. These activities are mediated by the accessibility of urban spaces depending on the city topography and its infrastructural networks4, a key component of which are the roads. Indeed, different street structures result in varying levels of efficiency, accessibility, and usage of the transportation infrastructure5,6,7,8,9,10,11. Structural characteristics, therefore, have been of great interest in the literature12,13,14,15 and many variants of structural quantities have been proposed and measured in urban contexts, including the degrees of street junctions16, lengths of road segments15, cell areas or shapes delineated by streets13, anisotropies14, and network centrality17,18. Collectively, these structural properties have uncovered unique characteristics of individual cities as well as demonstrated surprising statistical commonalities manifested as scale invariant patterns across different urban contexts19,20,21.

While these studies have shed light on the statistical structure of street networks, there is limited understanding of the interplay between the road structure and its influence on the movement of people and the corresponding flow of socio-economic activity; that is, the connection between urban dynamics and its associated infrastructure22. One way to tease out this connection is to examine the sampling of routes, that is an examination of how inhabitants of a city potentially utilize the street infrastructure. While a number of studies have been conducted on the empirical factors behind the choice of routes23,24,25,26,27, much remains to be done, in particular, understanding the morphological properties of route choices.

Indeed, the morphology of a route is shaped by the embedded spatial pattern of a city (land use and street topology) in association with dynamical factors such as congestion, accessibility, and travel demand, which relate to various attendant socio-economic factors. Analyzing the morphology of routes, therefore, allows us to potentially uncover the complex interactions that are hidden within the coarse-grained spatial pattern of a city. Furthermore, the morphology also encodes the collective property of routes, including their long-range functional effects. For example, a single street, depending on its connectivity and location, can have influence that spans the dynamics across the whole city (Broadway in New York City for instance)5.

In particular, traffic patterns and the shape of routes have been shown to be determined, among other factors, by two competing forces24. On the one hand, one finds an increased tendency of agglomeration of businesses, entertainments, and residential concerns near the urban center, correspondingly leading to a higher density of streets28,29 and thus attracting traffic and flows toward the interior of the city (positive urban externality). Conversely, this increasing density leads to congestion and increase in travel times (negative urban externality) thus necessitating the need for arterial roads or bypasses along the urban periphery to disperse the congestion at the core. This has the effect of acting as an opposing force, diverting the flow of traffic away from the interior of the city.

Here, we investigate these competing effects through a detailed empirical study of the shape of 472,040 travel routes between origin–destination points in the 92 most populated cities in the globe, representing all six inhabited continents. Each route consists of a series of connected roads; accompanying information on their geographical location, length, and speed limit retrieved from the OpenStreetMap database30. We split our analysis between the shortest routes (necessarily constrained by design limitations and city topography) and the fastest routes (representing the effects of traffic and dynamic route sampling), with the former representing aspects of the city morphology, while the latter in some sense representing the dynamics mediated by the morphology (see Methods for details). Specifically, the shortest routes are a function of the bare road geographic structure, while the fastest routes represent the effective geographic structure—a function of the heterogeneous distribution of traffic velocity resulting from varying transportation efficiency and congestion patterns31,32,33,34. To uncover the functional morphology of these two categories of routes, we define a geometric metric, which we term inness—a function of both the direction and spatial length of routes—that captures the tendency of travel routes to gravitate toward or away from the city center. This metric serves as a proxy for the geographical distribution of attractive forces that may be implicit in the sampling of streets (as reflected in directional bias) and that otherwise cannot be captured by existing measures. Our analysis represents a step toward the very important challenge of determining the spatial distribution of urban land-use and street topology to balance the inherent negative and positive urban externalities that result from rapid urbanization24.
Results 
Definition of inness I
Figure 1 illustrates the forces related to a city’s morphological patterns shaped by infrastructural and socio-economic layouts. For the case of a square grid, as shown in Fig. 1a, the shortest routes between any two points at a distance r either correspond trivially to the line connecting them directly, or are degenerate paths that traverse the grid in either direction. Taking the average of the multiple paths cancels any directional bias relative to the center of the grid. Yet, a small perturbation of this regularity can change this neutral feature dramatically, as shown in Fig. 1b, where we shift the four outermost points inward as to place them on the second ring from the center. Points lying on this ring have shortest routes that lie along the periphery, thus introducing a dispersive force away from the center (marked as blue arrows). In Fig. 1c, we further perturb the topology by adding four lines from the outer ring to the inner ring (marked in green) thus increasing connectivity toward the center. Shortest paths between pairs on the outer ring traverse through the inner ring and are curved toward the city center, resulting in an attractive force (represented as red arrows). Beyond this simple example, which is primarily a function of topology and is applicable to shortest paths, other factors are in play such as travel time and route velocity as considered in ref. 24, that will necessarily affect the patterns seen in fastest paths. Furthermore, the illustration assumes a single center of gravity, as it were, whereas such an effect may manifest itself at multiple scales, resulting in cancellation of any measurable force toward a putative city center.

Fig. 1


Fig. 1
Biasing forces found in urban morphology. Three schematic urban street arrangements share similar topological structure, but different geometric layouts resulting in varying dynamics. a A grid structure where the shortest paths between points at the same radius show no directional bias. b Repulsive forces relative to the origin (marked in blue) emerge as we break the grid symmetry by relocating the four outer points on the inner equidistant ring line. Paths lying on this ring now have the shortest paths that traverse the periphery and avoid the center. c Further perturbing the topology by increasing connectivity to the center (marked as four green lines) now leads to shortest paths that go through the center as if an attractive force is present (marked in red)
...MUCH MORE

Previously, here are a couple posts from 2017, there are quite a few in prior years as well:
"City Travel Scaling"
Today On Book Nook, the FT's Izabella Kaminska Reviews "Scale" (Why Cities Keep Growing, Corporations And People Always Die, And Life Gets Faster*)

Why 150 Million People In Six Red Sea Countries Should Be Watching Mauritius’ Oil Spill Response

It's been a month since we last checked in on this, nothing done yet.

From Forbes, August 24:
150 million people live in six countries along the Red Sea, Israel, Saudi Arabia, Egypt, Jordan, Djibouti, Sudan Eritrea. The Red Sea coastline contains some of the regions most important population centers with Jeddah (4 million in Saudi Arabia), Port Sudan, tourist hotspots of Hurgada and Safarga, as well as the fast growing coastal cities of Djibouti, Massawa, Al Hodeidah, Eilat and Aqaba.
https://specials-images.forbesimg.com/imageserve/5f4301a44ce016390a16d0ad/960x0.jpg?fit=scale
This region has some of the most unspoilt and richest coral reef ecosystems in the world, that have stayed relatively resilient from the climate crisis.

However, since July, concerns have been elevated that the entire Red Sea region is facing one of the world’s biggest environmental crisis: an oil spill of a magnitude never before seen in such a biodiversity sensitive area. Add in a world paralyzed with a coronavirus pandemic, and we have the perfect storm for a major humanitarian crisis that will play out in front of the world’s media.
There are now growing fears that the vessel could sink or explode - following water entering the tanker’s engine room. The rusting pipes and engine room that hasn’t been maintained for over five years, pose a particular hazard, as seen in dramatic footage taken last year.

If this was to happen, it would put the entire Red Sea, including one of the world’s busiest shipping lanes at risk of a major ecological catastrophe, the likes of which the world has never seen (most major oil spills have tended to be in lower population, remote locations).

Crude vs Bunker Fuel Oil Spills...
....MUCH MORE

Previously:
July 19 
Shipping: Derelict Oil Tanker With 1MM Bbl Cargo At Risk of Disintegrating Or Exploding

"Fed’s Total Assets Fall Again, Week 11 Since Peak-QE: Crazy Charts for Crazy Times"

From Wolf Street, August 27: 
“Two steps forward, two steps back”: Fed’s new song and dance, no?
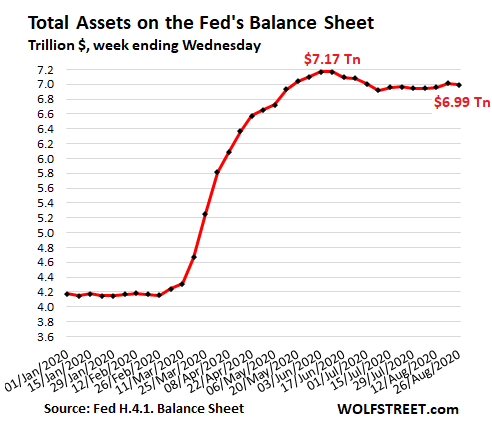
Total assets on the Fed’s balance sheet for the week ended August 26, released this afternoon, fell by $20 billion, to $6.99 trillion, after two weeks in a row of increases, which had followed two weeks in a row of declines, which had followed two weeks in a row of increases, which had followed four weeks in a row of declines. Two steps forward, two steps back — the Fed’s new song and dance? With the effect that total assets are now down by $179 billion from their peak on June 10:
So here’s how that happened by the five major QE-related categories on the Fed’s balance sheet: repos, central bank liquidity swaps, special purpose vehicles (SPVs), mortgage-backed securities (MBS), and Treasury securities.....
*****
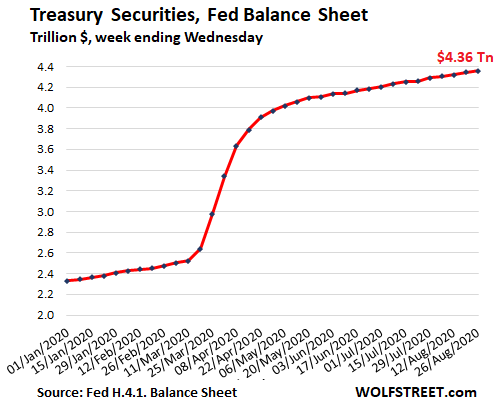
....Treasury securities rose by $13 billion to $4.36 trillion.

Since mid-May, the Fed has increased its Treasury holdings in a range between $6 billion and $29 billion a week, following the 10-week period, starting in mid-March, when it had gone hog-wild, buying at the peak $362 billion in the week ended April 1:
....MUCH MORE

Britain: "Dire wheat harvest after 'season of extremes' prompts bread price rise fears"

From a May 2019 post:
One of the Scariest Sentences In the English Language: Crop Progress Report Edition
"In the spring of 1315, unusually heavy rain began in much of Europe."
The story continues:
Throughout the spring and summer, it continued to rain and the temperature remained cool. These conditions caused widespread crop failures. The straw and hay for the animals could not be cured and there was no fodder for the livestock. The price of food began to rise. Food prices in England doubled between spring and midsummer. Salt, the only way to cure and preserve meat, was difficult to obtain because it could not be evaporated in the wet weather; it went from 30 shillings to 40 shillings. 
a quick note on British agriculture:
the vast majority of the wheat grown in the U.K is winter wheat planted in the fall, the same schedule as Kansas in the U.S.

From DevonLive, August 27:

Some millers have already increased the price of flour
Wheat being harvested at the end of July. British arable farmers are expecting to cut the smallest wheat area in 40 years, after a series of less than ideal weather conditions, from an unusually wet autumn to record-breaking dry spring

A “season of extremes” has left arable farmers facing their worst wheat harvest in 40 years, industry leaders have warned, prompting concerns of a price rise for bread and flour.
A series of weather setbacks, starting with heavy rain in the autumn which delayed crop drilling, followed by the wettest February on record, a record-breaking dry and sunny spring and further heavy rain this month has resulted in the UK’s lowest wheat crop area since the 1980s, according to the National Farmers’ Union (NFU), with yields expected to strike a similar multi-decade low.
As a result, some millers have already increased the price of flour by 10% and in the event of a no-deal Brexit, they say wheat imports could be liable for a hefty £79 per tonne tariff, pushing up prices even further....
....MUCH MORE

There won't be a famine and because of all the other input costs (baking, transport, packaging et al) even if wheat prices double the effect on the delivered loaf of bread is not as dire as the headlines might imply.
The other good news is that the risk of ergot poisoning from damp wheat is lower than it is with rye.
Your little ray of sunshine, that's me.

Back to the Wikipedia entry:
...The famine caused millions of deaths over an extended number of years and marked a clear end to the period of growth and prosperity from the 11th to the 13th centuries.

The Great Famine started with bad weather in spring 1315. Crop failures lasted through 1316 until the summer harvest in 1317, and Europe did not fully recover until 1322. The period was marked by extreme levels of crime, disease, mass death, and even cannibalism and infanticide. The crisis had consequences for the Church, state, European society, and for future calamities to follow in the 14th century....
Cannibalism.
Be on the alert for any neighbours with a hungry look in their eye.

Natural Gas Weekly Update

From the Energy Information Administration:
....Prices/Supply/Demand:
Prices rise in most demand hubs with storm activity in the Gulf of Mexico. This report week (Wednesday, August 19 to Wednesday, August 26), the Henry Hub spot price rose 15¢ from $2.36/MMBtu last Wednesday to $2.51/MMBtu yesterday, after reaching a high of $2.52/MMBtu on Monday and Tuesday. Temperatures across the Lower 48 states were generally warmer than normal, but cooler than normal on the Gulf Coast. At the Chicago Citygate, the price increased 10¢ from $2.23/MMBtu last Wednesday to $2.33/MMBtu yesterday.

Hurricane Laura makes landfall in Southwestern Louisiana, affecting key natural gas infrastructure. Hurricane Laura made landfall early this morning as a strong Category 4 storm. Laura struck close to the Louisiana-Texas border, home to key U.S. energy infrastructure. According to the Bureau of Safety and Environmental Enforcement (BSEE), as of yesterday, BSEE estimates that approximately 61% of natural gas production and 84% percent of the current oil production in the Gulf of Mexico has been shut-in based on operator reports, resulting from the evacuation of nearly half of the manned platforms. According to Genscape, operational flow orders or force majeures have been issued on the ANR, Cameron, Columbia Gulf, Kinder Morgan Louisiana, and Natural Gas Pipeline Co. of America systems. Cameron and Sabine Pass liquefied natural gas (LNG) export terminals were completely offline as of early Thursday. These disruptions further reduced LNG feedstock, which averaged 4.3 Bcf/d, or 0.3 Bcf/d lower than last week, and fell to as low as 2.3 Bcf/d on Wednesday ahead of Hurricane Laura making landfall.

The U.S. Energy Information Administration’s (EIA) Energy Disruptions map shows storm-related geographic data (also referred to as map layers) from the National Hurricane Center and the National Weather Service and EIA's map layers for energy-related infrastructure such as LNG export terminals, natural gas processing plants, natural gas pipelines, high-voltage transmission lines, and power plants.

California prices are mixed as the state continues to battle wildfires. The price at PG&E Citygate in Northern California rose 19¢, up from $3.31/MMBtu last Wednesday to a high of $3.50/MMBtu yesterday. The price at SoCal Citygate in Southern California decreased $1.54 from a high of $6.15/MMBtu last Wednesday to $4.61/MMBtu yesterday as temperatures began to moderate toward the end of the report week. As of yesterday, California continued to battle more than two dozen active wildfires. Natural gas stocks in the Southern California Gas (SoCalGas) system declined 0.7 Bcf over the report week and are down 4.6 Bcf compared to late July, when stocks were at their highest point of the summer.

Northeast prices rise. At the Algonquin Citygate, which serves Boston-area consumers, the price went up 21¢ from a low of $1.31/MMBtu last Wednesday to $1.52/MMBtu yesterday as Boston-area temperatures were warmer than normal, approaching 90 degrees Fahrenheit on multiple days during the report week. At the Transcontinental Pipeline Zone 6 trading point for New York City, the price increased 79¢ from a low of $1.19/MMBtu last Wednesday to a high of $1.98/MMBtu yesterday.
The Tennessee Zone 4 Marcellus spot price increased 15¢ from $1.07/MMBtu last Wednesday to $1.22/MMBtu yesterday. The price at Dominion South in southwest Pennsylvania rose 22¢ from $1.14/MMBtu last Wednesday to $1.36/MMBtu yesterday.

Permian Basin prices are down. The price at the Waha Hub in West Texas, which is located near Permian Basin production activities, averaged $1.65/MMBtu last Wednesday, 71¢/MMBtu lower than the Henry Hub price. Yesterday, the price at the Waha Hub averaged a low of $1.07/MMBtu, $1.44/MMBtu lower than the Henry Hub price.
Supply falls slightly. According to data from IHS Markit, the average total supply of natural gas fell by 0.5% compared with the previous report week. Dry natural gas production decreased by 1.0% compared with the previous report week amidst shut-in natural gas production in the Gulf of Mexico. Average net imports from Canada increased by 10.3% from last week but remain a relatively small component of supply.

Demand rises, driven by increased power generation. Total U.S. consumption of natural gas rose by 0.8% compared with the previous report week, according to data from IHS Markit. Natural gas consumed for power generation climbed by 1.3% week over week. In the residential and commercial sectors, consumption increased by 0.8%. Industrial sector consumption decreased by 0.2% week over week. Natural gas exports to Mexico increased 8.0%.

U.S. LNG exports decrease week over week. Seven LNG vessels (two each from Sabine Pass and Cameron, and one each from Freeport, Corpus Christi, and Cove Point) with a combined LNG-carrying capacity of 26 Bcf departed the United States between August 20 and August 26, 2020, according to shipping data provided by Marine Traffic.

Two U.S. LNG liquefaction facilities—Sabine Pass and Cameron—are located in the direct path of Hurricane Laura. Both facilities have suspended operations and implemented a controlled shutdown, according to reporting by Bloomberg L.P....
....MUCH MORE

Capital Markets: "Powell and Abe Drive Markets"

From Marc to Market:
Overview: After a confused and volatile reaction to the Federal Reserve's formal adoption of an average inflation target, it took Asian and European traders to embrace the signal and take the dollar lower.
It is falling against nearly all the currencies and has slumped to new lows for the year against sterling and the Australian dollar. Compounding the volatility, Japan's Prime Minister Abe has signaled his intention to resign over health issues as soon as the LDP picks a successor.
 The yen strengthened, in line with the other major currencies, but the Nikkei fell. Asia Pacific equities were mostly lower, with Chinese, Korean, and Indian shares posting independent gains. Note that New Zealand's exchange has been a victim of a cyberattack for the fourth session.
European stocks are also a bit heavy and are paring this week's gains. US shares are trading higher. The S&P 500 has a six-day advancing streak in tow coming into today. Benchmark 10-year yields are higher. Asia Pacific yields were pulled higher by the jump in US yields yesterday, and Australia's 10-year yield jumped 10 bp, and European yields are 2-3 bp higher today. The US 10-year yield is extended yesterday's rise and is now around 76 bp after reaching 78 bp, the highest since early June. Gold is trading firmly, but well within yesterday's broad range. Oil prices have drifted lower, and the October WTI contract is within yesterday's range, and slipping below the 200-day moving average (~$43.15).

Asia Pacific
Speculation that Abe's health issues were going to force his resignation had circulated in recent days.
We had thought it was more likely that today's announcement was going to be about the pandemic. However, Abe did, in fact, submit his resignation, effective after the LDP picks his successor. We recognized that there were alternatives to Abe, but less convinced about alternatives to Abenomics, which seemed like traditional LDP policy choices (loose monetary and fiscal policy and tax consumption). While some potential successors have been critical of low interest rates, it is difficult to see a different strategy.

Consider today's economic news from Tokyo.
Headline August CPI was unexpectedly halved to 0.3% year-over-year. The core rate, which excludes fresh food, fell back into deflationary territory (-0.3% from +0.4%). Excluding fresh food and energy, Tokyo prices are 0.1% below year-over-year levels after being +0.6% in July. That said, the report may exaggerate the downside pressure on prices as there was a one-off drop in accommodation prices (Tokyo was excluded from the national campaign to promote travel, but the calculation uses national indices).

The dollar initially extended its gains to almost JPY107 in early Asia Pacific turnover, but Abe's resignation spurred a sharp sell-off that took the greenback below yesterday's low around to JPY105.50 in the European morning.
A weak close today would set up a possible test on JPY105, the August low next week, and possibly a test on the July low (~JPY104.00). The Australian dollar extended yesterday's gains and is at new highs for the year above $0.7300. It has reached nearly $0.7325. The next important technical target is near $0.7500. The PBOC set the dollar's reference rate at CNY6.8891, a little above the median bank model in the Bloomberg survey. It is the fifth week, the yuan has risen against the dollar, and the fourth week it has risen against its CFETS basket. The dollar is at new seven-month lows against the yuan. The 10-year Chinese bond yield rose to 3.08%, its highest since mid-January.

Europe....
....MUCH MORE

Thursday, August 27, 2020

"The future of food from the sea"

From the journal Nature, August 19:
Abstract
Global food demand is rising, and serious questions remain about whether supply can increase sustainably1. Land-based expansion is possible but may exacerbate climate change and biodiversity loss, and compromise the delivery of other ecosystem services2,3,4,5,6. As food from the sea represents only 17% of the current production of edible meat, we ask how much food we can expect the ocean to sustainably produce by 2050. Here we examine the main food-producing sectors in the ocean—wild fisheries, finfish mariculture and bivalve mariculture—to estimate ‘sustainable supply curves’ that account for ecological, economic, regulatory and technological constraints. We overlay these supply curves with demand scenarios to estimate future seafood production. We find that under our estimated demand shifts and supply scenarios (which account for policy reform and technology improvements), edible food from the sea could increase by 21–44 million tonnes by 2050, a 36–74% increase compared to current yields. This represents 12–25% of the estimated increase in all meat needed to feed 9.8 billion people by 2050. Increases in all three sectors are likely, but are most pronounced for mariculture. Whether these production potentials are realized sustainably will depend on factors such as policy reforms, technological innovation and the extent of future shifts in demand.
MainHuman population growth, rising incomes and preference shifts will considerably increase global demand for nutritious food in the coming decades. Malnutrition and hunger still plague many countries1,7, and projections of population and income by 2050 suggest a future need for more than 500 megatonnes (Mt) of meat per year for human consumption (Supplementary Information section 1.1.6). Scaling up the production of land-derived food crops is challenging, because of declining yield rates and competition for scarce land and water resources2. Land-derived seafood (freshwater aquaculture and inland capture fisheries; we use seafood to denote any aquatic food resource, and food from the sea for marine resources specifically) has an important role in food security and global supply, but its expansion is also constrained. Similar to other land-based production, the expansion of land-based aquaculture has resulted in substantial environmental externalities that affect water, soil, biodiversity and climate, and which compromise the ability of the environment to produce food3,4,5,6. Despite the importance of terrestrial aquaculture in seafood production (Supplementary Fig. 3), many countries—notably China, the largest inland-aquaculture producer—have restricted the use of land and public waters for this purpose, which constrains expansion8. Although inland capture fisheries are important for food security, their contribution to total global seafood production is limited (Supplementary Table 1) and expansion is hampered by ecosystem constraints. Thus, to meet future needs (and recognizing that land-based sources of fish and other foods are also part of the solution), we ask whether the sustainable production of food from the sea has an important role in future supply.

Food from the sea is produced from wild fisheries and species farmed in the ocean (mariculture), and currently accounts for 17% of the global production of edible meat9,10,11,12 (Supplementary Information section 1.1, Supplementary Tables 13). In addition to protein, food from the sea contains bioavailable micronutrients and essential fatty acids that are not easily found in land-based foods, and is thus uniquely poised to contribute to global food and nutrition security13,14,15,16.
....MUCH MORE