Long time readers will remember Professor Weitzman, along with Tol and
Nordhaus, as one of the bigs of climate change economics. His paper "A Review of The Stern Review on the Economics of Climate Change" was one of the first to point out the goofy-ass discount rate [a technical term] that Sir (now Lord) Stern used.
While Weitzman's c.v. indicates difficulty keeping a job, bouncing from
Yale to MIT to Harvard, some of his stuff is near-genius level.
Although Prof. Weitzman's self-reported current research interests are:
Environmental and Natural Resource Economics, Climate Change,
Discounting, Economics of Catastrophes, Cost-Benefit Analysis,
Comparison of Alternative Instruments for Controlling Pollution, Green
Accounting, Economics of Biodiversity, Role of Uncertainty in
Environmental Economics.
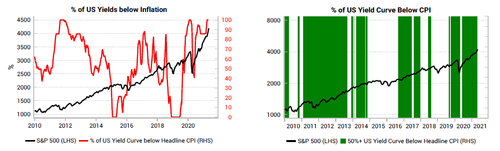
We
have seen much commentary that if US 10y yields go back to 2.5% or
3.0%, then equity markets suffer. We prefer a different way to looking
at the problem. The key is what inflation is doing alongside any move
in nominal yields. The below chart shows the % of the US yield curve
trading below inflation. We highlight in green the periods when more
than 50% of the yield curve is trading below inflation (as is the case
today).
Typically, negative real yields are very stimulative for equities.
It is only when most of the yield curve is trading above inflation
(white bars in right chart above) that equity markets start to face
persistent headwinds.
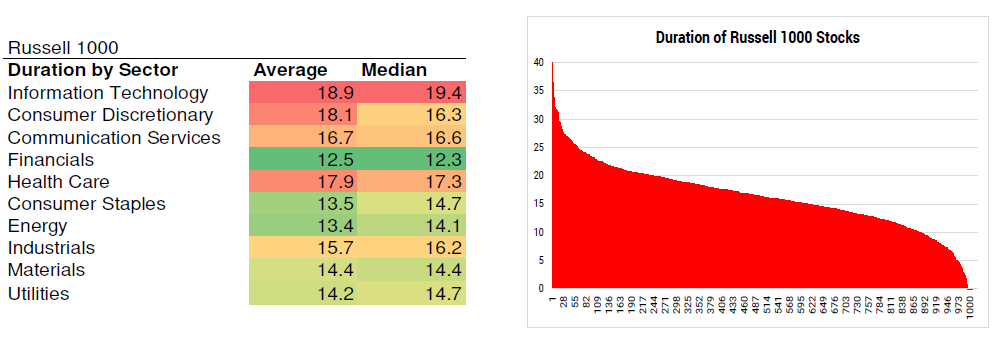
Equity investors do need to worry about
rising yields in terms of sector rotation. Duration is a basic concept
for fixed income investors, but for equity investors, it is a less
common method to look at portfolio exposures.
We have built a
duration calculator for equities, using a combination of a 15-year DCF
(consensus earnings forecasts, 2% terminal growth rate, individual cost
of equity) and a terminal value duration component. This allows us to
see which equities are most sensitive to a move in yields.
For
the stocks in the Russell 1000, we calculate the duration of each name
and aggregate to find the duration for different sectors. Financials,
energy and consumer staples look like relative safe-havens. Info tech, healthcare and consumer discretionaries have the highest durations and are more vulnerable to yield moves.