Attentive reader may have noticed we are not making as much noise about the ongoing drought in California as some folks are. As long as the government is sending water into the Pacific so the smelt can swim it is hard to get worked up about cries of emergency. Lake Powell may drop far enough to cut into Cali's electricity supply but it wasn't me ignoring the lessons of history. Seven years ago we were posting: "California: The Last 200 Years Were The Happy Time For Weather, Get Ready For A Return to The West Without Water".
And every year we post the graph from "The Economics of the California Water Shortage"
Where this gets really interesting is when you throw a historical perspective on the current California drought:
—San Jose Mercury-News "California drought: Past dry periods have lasted more than 200 years, scientists say"
Regarding the drought in the desert southwest that is threatening Phoenix, Las Vegas and tangentially Los Angeles, ummm "Desert Southwest".
Back in 2008 we posted these handy little maps
And noted:
...The relationship between drought in the continental US and the phases of the Pacific Decadal Oscillation (PDO) and the Atlantic Multidecadal Oscillation (AMO). The most severe droughts occur when the PDO is in a negative phase, and the AMO is in a positive phase....The ocean SeaSurfaceTemperature anomalies are currently negative PDO and positive AMO i.e. the map at bottom right.
Here is the most recent Drought Monitor map:

Hey, looky there!!! Credit for the forecast maps must go to:
McCabe G J et al. PNAS 2004;101:4136-4141From McCabe (2004):
More than half (52%) of the space and time variance in multidecadal drought frequency over the conterminous United States is attributable to the Pacific Decadal Oscillation (PDO) and the Atlantic Multidecadal Oscillation (AMO). An additional 22% of the variance in drought frequency is related to a complex spatial pattern of positive and negative trends in drought occurrence possibly related to increasing Northern Hemisphere temperatures or some other unidirectional climate trend. Recent droughts with broad impacts over the conterminous U.S. (1996, 1999-2002) were associated with North Atlantic warming (positive AMO) and northeastern and tropical Pacific cooling (negative PDO). Much of the long-term predictability of drought frequency may reside in the multidecadal behavior of the North Atlantic Ocean. Should the current positive AMO (warm North Atlantic) conditions persist into the upcoming decade, we suggest two possible drought scenarios that resemble the continental-scale patterns of the 1930s (positive PDO) and 1950s (negative PDO) drought.
The most recent monthly readings for the AMO, January - May 202, are positive:
2021 0.137 0.150 0.123 0.065 0.082
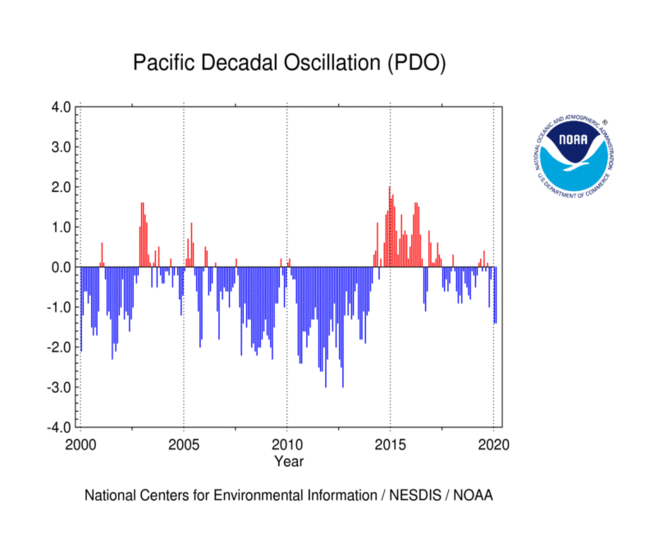
And the PDO (on blogroll at right) is negative:

So there's a drought where McCabe predicted there would be a drought.
This is getting to be a longer post than I had intended and we've yet to get to the real moneymaker over the next couple weeks: there's been rain over the central growing region of the U.S. and there is more forecast so enough with the scary map with all the red on it. (it is scary but as noted by McCabe on average 25% of the U.S. is in drought).
Coming up, some big reports.