I know a lot of folks are saying yesterday's move in oil was some gazillion-sigma event, much as Goldman's CFO, David Vinier referred to the bank's losses during the quant-quake of 2007 as due to "25-sgma" moves.
As noted at the time in
"How Unlucky is 25-Sigma?
By Kevin Dowd, John Cotter, Chris Humphrey and Margaret Woods
March 24 2008
By Kevin Dowd, John Cotter, Chris Humphrey and Margaret Woods
March 24 2008
1. Introduction
One of the more memorable moments of last summer’s credit crunch came when the CFO of Goldman Sachs, David Viniar, announced in August that Goldman’s flagship GEO hedge fund had lost 27% of its value since the start of the year. As Mr. Viniar explained, “We were seeing things that were 25-standard deviation moves, several days in a row.”1 One commentator wryly noted:Here's the math:
That Viniar. What a comic. According to Goldman’s mathematical models, August, Year of Our Lord 2007, was a very special month. Things were happening that were only supposed to happen once in every 100,000 years. Either that ... or Goldman’s models were wrong (Bonner, 2007b
2. How Unlikely is a 25 sigma event?
The once-in-a-100,000 year figure was quoted in a number of places,2 and suggests that Goldman, Citi and so on must have been very unlucky indeed. But exactly how unlikely is a 25-sigma shock?
To start with, lets assume that losses are normally distributed – assume that losses obey the classic bell curve – and ask the question: what is the probability of a loss that is, say, 2 standard deviations or more away from the mean, i.e., what is the probability of a 2-sigma loss event? The answer is given in Figure 1: the probability associated with a 2 sigma event is equal to the mass of the right-hand tail of the distribution demarcated at the point where the number of standard deviations from the mean is equal to 2, and this is equal to 2.275%.
We might therefore expect to see a 2-sigma loss event on one trading day out of 1/2.275%=43.956 days, i.e., on approximately 1 day out of 44 days. A 2-sigma event is unlikely to occur on any given day, but we would expect to see a few of them in any given year.....
....The reader will note that as k gets bigger the probabilities of a k-sigma event fall extremely rapidly:
•a 3-sigma event is to be expected about every 741 days or about 1 trading day in every three years;
•a 4-sigma event is to be expected about every 31,560 days or about 1 trading day in 126 years (!);...MORE (7 page PDF)
•a 5-sigma event is to be expected every 3,483,046 days or about 1 day every 13,932 years(!!)
•a 6-sigma event is to be expected every 1,009,976,678 days or about 1 day every 4,039,906 years;
•a 7-sigma event is to be expected every 7.76e+11 days – the number of zero digits is so large that Excel now reports the number of days using scientific notation, and this number is to be interpreted as 7.76 days with decimal point pushed back 11 places. This frequency corresponds to 1 day in 3,105,395,365 years....
The point is, you do not need events that occur only on a cosmic timescale to have far-reaching effects across connected systems. 3 or 4-sigma will do quite nicely if you are caught on the wrong side of a move.
From FT Alphaville:
Lookout, there’s a dollar crunch!
As Zoltan Pozsar of Credit Suisse warned a couple of weeks ago, the combination of a glut of safe assets in the market, plus a Fed still intent on keeping monetary policy tight, has been feeding through to repo markets in the form of volatility.
But now we have this (hat tip to Marc Ostwald from ADMISI for the chart):
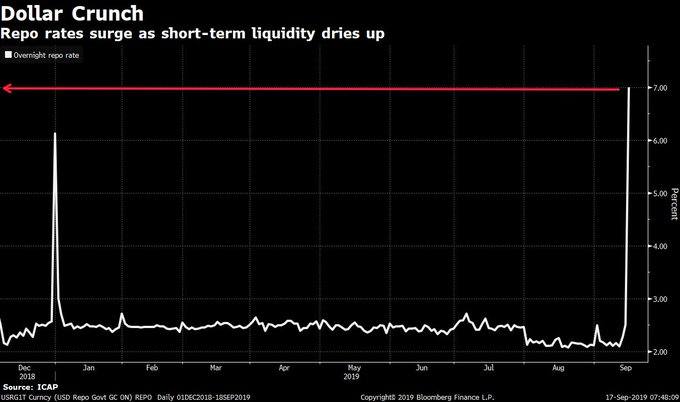
That’s a relatively wild spike in US general collateral repo rates to as much as 8.25 per cent at the open, at a bid/offer spread of 9.0%/7.50%.
This is seismic stuff — and possibly indicative of a real dollar crunch — not least because it’s not even the quarter’s end (the usual time funding squeezes emerge).
Therefore something else must be driving the dash for cash.
Repo focused analysts such as TD Securities’ Priya Misra and Gennadiy Godberg note the market is blaming a combination of things including the corporate tax date (which creates a demand for liquidity), bill supply, coupon settlements and GSE cash as potential reasons for the spike.
But since much of that should already have been priced in — and this is the third time repo rates have spiked to abnormally high rates the past year — they, in line with Pozsar’s thinking, are blaming structural factors. And, in particular, a general scarcity of bank reserves:....MUCH MORE
Reserves have been declining since 2014 and we expect them to decline further as Treasury's cash balance increases and currency in circulation grows. The spike in repo affects the transmission of monetary policy and we expect the Fed to take the spike in repo rates seriously....
We retold the Vinier story in "David Viniar retiring as Goldman CFO (GS)" and in "The Next Quant Meltdown"