From Afraid to Trade:
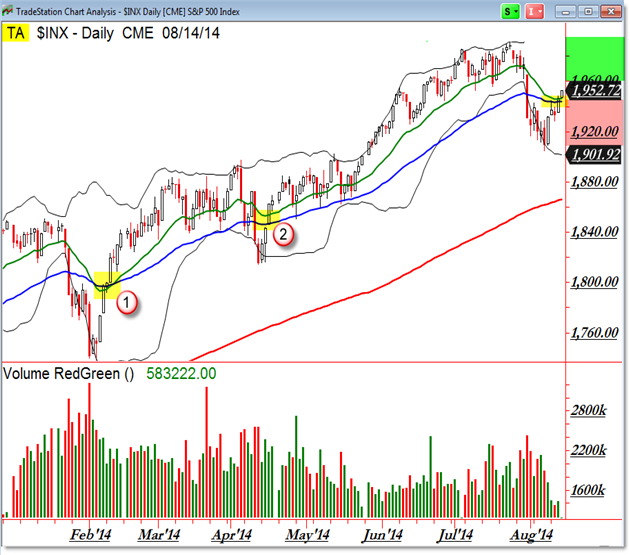
SP500 Decided to Break On Through to the Other Side
Aug 14, 2014: 11:22 AM CST
Not to be spooked by a little retracement in the market, the buyers (bulls) decided to break price higher to the “other side” of the 20/50 EMA resistance.
Let’s update our chart and note the “Open Air” as price completes another repeat pattern:

...MORE
S&P 500 1952.97 up 6.25 and 1.9% under the all-time high.
For some reason I feel the urge to visit a graveyard in Paris.