Following up on "Uh Oh: Bank Lending Appears to Have Peaked", immediately below.
From All Star Charts:
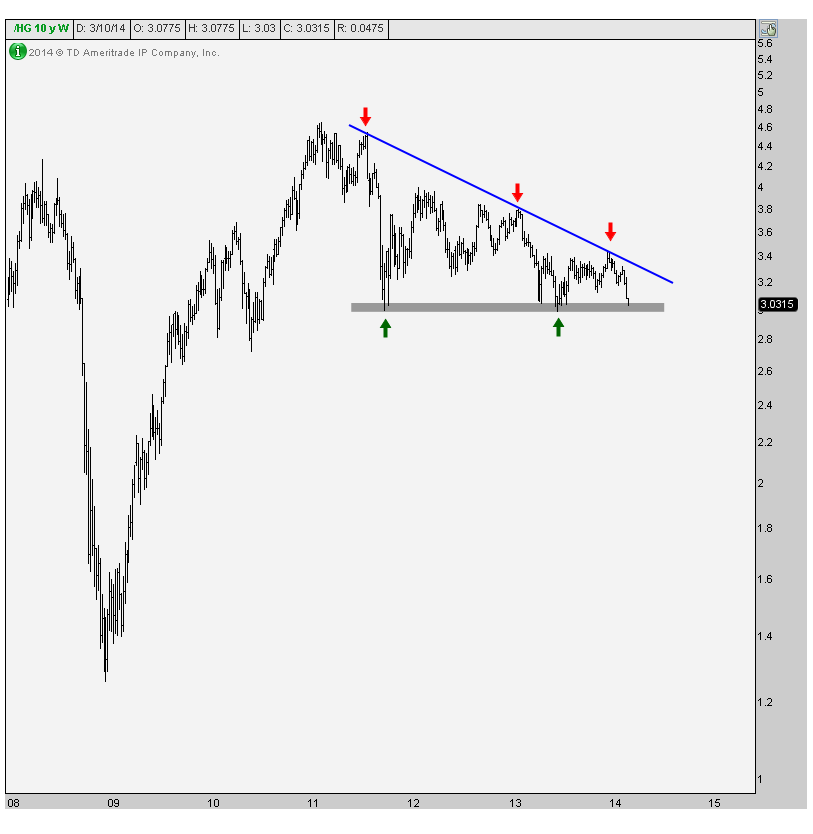
Paging Doctor Copper
Not all commodities are created equal my friends. As great as this space has been all year and as bulled up as I am, Copper is simply not one of them. Down over 10% so far for 2014, what the heck is up with Copper?
The charts actually look a lot like emerging markets. Which isn’t good. The numbers agree as well – the 3 and 4 year correlations are 0.73 and 0.79 between Emerging Markets and Copper (EEM/JJC). That’s pretty high and the charts tell that story well.
Here is a weekly bar chart going back to the lows put in at the end of 2008. After a monster rally, prices started to peak in early 2011, right around the same time that the MSCI Emerging Markets Index made its highs:
...MORE