(just kidding, Professor).
From AQR Capital Management (Nov. 2012):
An Old Friend: The Stock Market’s Shiller P/E
This commentary was excerpted with minor edits from the third-quarter 2012 letter to investors in AQR’s Absolute Return Fund.
It’s been a long-time since we’ve discussed this, but since it’s actually the source of some current controversy,1 now seems like a good time to re-examine the valuation of the entire U.S. stock market, and particularly the relevance and meaning of the Shiller P/E, a measure we have favored in the past.
Recall that researchers have found that valuation measures have some power to forecast long-horizon (say 10- year) stock market returns. Of course, there is not one unique valuation measure known to be perfect, and most possible choices have their pros and cons. In particular, for many years, researchers and practitioners have made use of the price-to-earnings ratio. For every dollar you invest in the S&P 500, how many dollars of earnings do you get (not that an investor actually receives all the earnings)?
Now, while the “price” in price-to-earnings is well specified, there is generally no agreement on what to use for earnings. One can use operating or total earnings. One can use forecasted or trailing earnings. One can use last quarter, last year, or even longer to measure earnings. Many other adjustments and methods are possible.
In particular, though we will touch on some of the other possibilities, we will focus primarily on two measures at the forefront of today’s argument: A market P/E calculated using standard one-year trailing total earnings vs. what has come to be called the “Shiller P/E.”3 The idea of the Shiller P/E arose from the observation that one-year earnings are highly volatile and probably mean-reverting. Thus, at times of very high earnings, the one-year P/E might look “too low” (stocks too cheap) and when earnings are very low, the opposite can occur and the one-year P/E might look “too high” (stocks too expensive). At extremes, like very bad recessions, earnings can get so low as to approach or pass zero, making the one year P/E obviously silly (this almost happened in 2008/09).
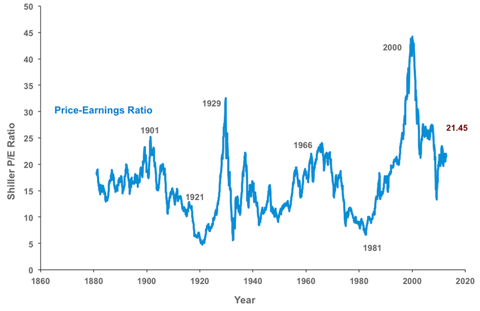
What the Shiller P/E does to adjust for this problem is simple and effective, if obviously imperfect. Instead of using oneyear trailing earnings, it uses the average of the prior 10 years of trailing earnings (inflation adjusted).4 Ten years is, of course, arbitrary. You would be hard-pressed to find a theoretical argument favoring it over, say, nine or 12 years. However, it struck its creators and many of us as reasonable and intuitive. It extends over one or two typical business cycles without going too deeply into the very distant past. Put simply, one-year P/E’s represent what an investor pays for the last years’ worth of S&P 500 earnings, again a very volatile number. In contrast, the Shiller P/E represents what an investor pays for the last 10 years’ average real S&P 500 earnings. The hope is that this is a more stable measure that is more relevant to long-term future stock returns and earnings.
So, what do Shiller P/E’s look like over history up until today?...MORE (8 page PDF)
HT: CFA Institute
Previously:
UPDATED--Cliff Asness' AQR Capital: A Century of Evidence on Trend-Following Investing; Since 1903
Cliff Asness’s AQR Staff Built Him A Robot Warren Buffett (BRK.B)
Elections and Markets: Okay, Rob Arnott isn't ALWAYS Right
Man vs. Machine on Wall Street: How Computers Beat the Market (and should they be banned?)
See for "The Only Free Lunch in Economics"
AQR Capital Management LLC: A $100,000 Prize for Academic Papers in Finance
Here's a nice little paper that über-quant Asness did with Rob Arnott:
Surprise! Higher Dividends= Higher Earnings Growth