I was asked last night why all the recent posts on Apple?
It's simple: "Apple is the Market, the Market is Apple: "Some Quick Facts About Apple's Massive Market Footprint" (AAPL; QQQ; NDX; SPY)".
Here's some more, from Asymco:
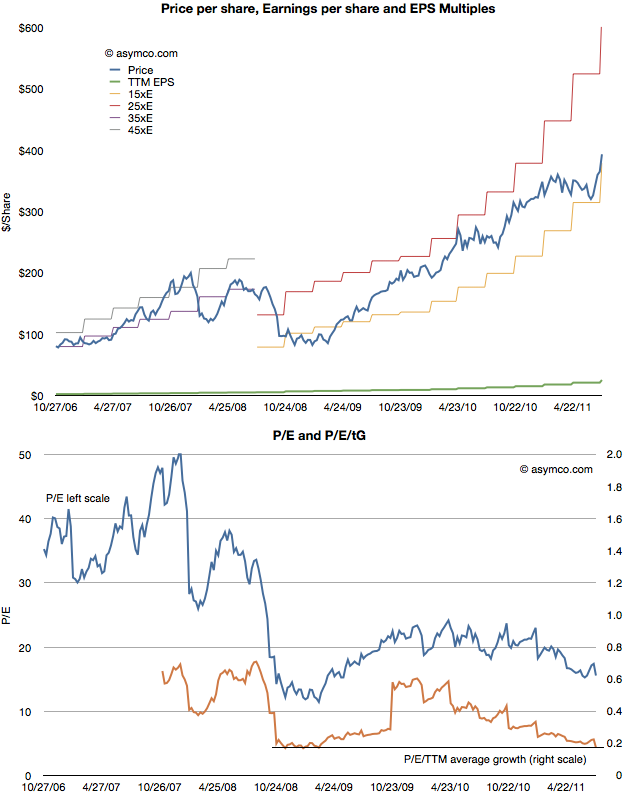
After Apple reported earnings growth of 125% its share price dropped to a P/E of about 15. This reduction in valuation is part of a trend I’ve written about for over a year so there were no surprises. The first chart below shows how the stock has traded between increasingly lowered P/E bands.HT: Abnormal Returns
As the second chart shows, not only is the P/E ratio declining, but when seen against the trailing twelve months (TTM) average growth rate, the P/E/TTM ratio is now at the lowest since the great recession (around 0.17–a value of 1.0 is a rule of thumb for “fair value” in a growth stock)....
...
Those values include cash. Excluding cash, the P/E as of Friday was 12.4. On a forward basis (my estimate–which has shown be be conservative lately) the P/E is around 7....MORE
See also:
A New Way to Value Apple (AAPL)
Re-post--Apple: Analyst Roundup; Ominous New Street-High $666 (AAPL; QQQ)
