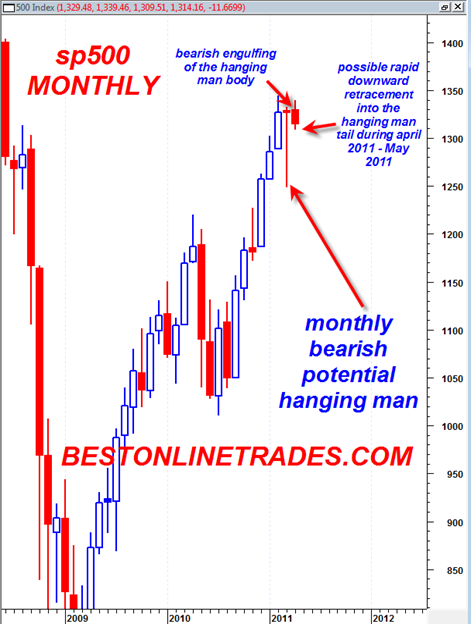
...I was recently reviewing the monthly candlestick chart on the S&P 500 (NYSE:SPY) and it seems pretty clear to me now that the March 2011 monthly price candlestick is ‘potentially’ the most bearish monthly hanging man candlestick we have seen since in 41 years on the sp500. My chart data on the S&P 500 only goes back 41 years, so there could be a monthly hanging man that looks just as bearish as the March 2011 candle, but at least going back to 1970 I have not seen any with as much bearish potential as this one. In other words I have not seen in 41 years a monthly hanging man with such a LONG bottoming tail and a clean body with almost no top candle wick on it.For more on candlestick charting:
This monthly March 2011 hanging man candlestick is potentially very bearish because it has all of the perfect elements that make for a potent hanging man candle.
Hanging man candlesticks are essentially hammer candlesticks that form after extensive price advances. They have the appearance of a bullish signal, but it is potentially the exact opposite.
- It has a very long bottoming tail, huge.
- It has a very small real body and the body is red, or negative close
- It has a very small upper shadow.
- The open is very close to the closing price, almost making it a doji hanging man, or rickshaw man candlestick.
- It has formed after an almost straight up rally of 5 to 6 months duration.
They still do need to be confirmed however. The potential bearishness comes in as follows: Since the open is very close to the close, you have a situation where a lot of the buyers are either in at the open or at the close.
But then if the next candlestick opens down or QUICKLY engulfs the body of the hanging man candlestick, then all those who piled in at the open and close are left ‘hanging’ so to speak.
This can cause more rapid selling once they realize how ‘trapped’ they are near the highs.
The rising wedge formation that formed from mid March 2011 up to the present is consistent with a market that can fall quickly and so would support the case of trapping the buyers on close of the March 2011 hanging man candlestick.
I have seen some hanging man candlesticks in the past get retraced DOWN very rapidly in some cases because of this psychological dynamic, thereby trapping or hanging the complacent holders near the highs.
It is also important to recognize that this is a MONTHLY March 2011 hanging man candlestick which has larger time and trend implications than daily or weekly hanging man candlesticks. In other words, if this monthly bearish hanging man confirms, then it could mean bearish price action for several months at a minimum.
The monthly chart above clearly shows the long tail on the monthly hanging man candlestick for March 2011.
If you want to see a similar hanging man candlestick on the daily time frame just zoom in on the daily price action of August 2010....MORE
The Best Hedge Fund Manager of All-Time
Our Hero
I try to post this at least once per annum, the last couple years around cherry blossom time. This year I'm a bit early.
1440 Wall Street tips us to an amazing story of intellectual (and financial) achievement.
I've been using this fellow's invention for half my adult life and had never heard the backstory....MORE

