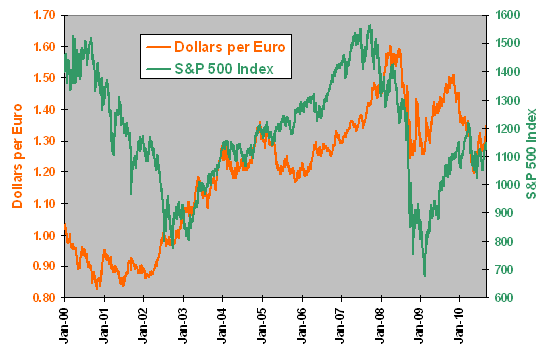
"Dollar-Euro Exchange Rate and U.S. Stocks"
From CXO Advisory:
Whenever a trend in the dollar-euro exchange rate appears, experts theorize. A falling dollar is good because U.S. exports boom and domestic employment rises. Or, a falling dollar is bad because capital flees the U.S., and import prices spur inflation. Are there any reliable and exploitable relationships between the dollar-euro exchange rate and U.S. stocks? To check, we apply regressions and rankings to characterize the short-term and intermediate-term interactions between the exchange rate and the stock market. Using daily data for the dollar-euro exchange rate and the S&P 500 Index over the period January 2000 through (most of) September 2010 (about 2,700 trading days), we find that:
The following chart tracks the dollar-euro exchange rate (dollars per euro) and the S&P 500 Index over the entire sample period. During this time the dollar generally weakens (the number of dollars per euro rises), and the stock market exhibits fits of historically high volatility. Visual inspection suggests that the exchange rate and stock market sometimes move oppositely and sometime move together.
For a closer look, we relate past changes in the exchange rate to future returns for stocks.

The following scatter plot relates change in the dollar-euro exchange rate over the past five trading days to S&P 500 Index return over the next five trading days during the entire sample period. For independence of observations, we winnow the sample by selecting every fifth trading day (538 observations). The Pearson correlation is for the two series is 0.13 and the R-squared statistic is 0.02, indicating that variation in the dollar-euro exchange rate last week explains 2% of the variation in the S&P 500 Index next week.
We replicate the test for two longer intervals:
Relating change in the dollar-euro exchange rate over the past 21 trading days to S&P 500 Index return over the next 21 trading days (sampling every 21st trading day for a total of 127 observations) yields a Pearson correlation of 0.04 and an R-squared statistic of 0.00.
Relating change in the dollar-euro exchange rate over the past 63 trading days to S&P 500 Index return over the next 63 trading days (sampling every 63rd trading day for a total of only 42 observations) yields a Pearson correlation of 0.18 and an R-squared statistic of 0.03.
Based on these analyses, movement in the exchange rate is of little use in predicting short-term or intermediate-term stock market returns.
As a robustness test, we look at subperiods....MORE
