Friday, October 13, 2017

"Jeff Bezos Screws Over Workers At Amazon. Now He Wants To Do The Same At The Washington Post."

The headline is the HuffPo's, which is sort of ironic if you know the history of the HuffPo.
From the Huffington Post:

Can Silicon Valley’s anti-labor attitude survive actual contact with a labor union?
Like most of the industry titans in the world of big tech, Amazon billionaire Jeff Bezos is no fan of labor unions. Since 1994, he’s fended away every effort by Amazon warehouse workers to unionize.
But when Bezos purchased The Washington Post in 2013, he inherited more than 1,200 workers unionized with the Washington-Baltimore News Guild. That union now claims that Bezos and Washington Post management are trying to gut protections and benefits for workers in the latest contract negotiations.

“Under the Bezos ownership, we fear a fundamental transformation is under way at the Post — one that is occurring in many other workplaces around the country, leading to economic insecurity for working people as though we are disposable or interchangeable elements in a machine,” the union bargaining committee wrote in a memo sent to Post employees on Oct. 6.

According to the memo, management wants to end the paper’s long-standing practice of across-the-board percentage annual pay raises to create an “unprecedented” merit pay system and cut severance benefits. It also refuses to increase the 401(k) match from 1 percent.

The merit system would potentially freeze even inflation adjusted increases in pay for some employees for up to 30 months while others could get up to a 4 percent increase. Management has also proposed to cut severance pay and require any employee who accepts severance to waive their legal rights. When you do away with routine raises only the superstar reporters will wind up getting them. This would leave copy editors, video editors and others who are not the face of the paper on the losing end and increase inequality within the company.

Management has also offered a fallback proposal that will give employees a $600 payment in the first year and then an $8 raise per week in the second year.

This proposal comes with the added threat of an even worse proposal if the union does not agree to the current terms by Nov. 1, the bargaining committee said it its memo.

The bargaining committee has called management’s proposal a “terrible, short-sighted, morale-destroying proposal” that would “deliver real pain to many employees and transform a team enterprise into a collection of salary winners and losers.” The Post declined to comment for this article.

It isn’t as though money is tight for the Post. Profits and revenue are up, and digital subscriptions have tripled. The paper has hired a huge amount of talent, and its reporters have broken numerous major stories about the Trump administration. Even if the paper weren’t profitable it is backed by one of the three wealthiest people in the world. Bezos is worth an almost unfathomable $84 billion....MORE
Although it's around 800 miles between Seattle and Silicon Valley the mindset is similar.
As noted in 2014's "What Uber Hath Wrought: The Coming Digital Labor Movement": 
The very last thing the poobahs of Sand Hill Road want to see. They overwhelmingly prefer NO unions.

During the 2008* Democratic nomination campaign we pointed out that although the self-anointed Silicon Valley aristocracy were solidly behind Senator Obama, rank-and-file Dems in Santa Clara county went for Hillary 54.8% to Obama's 39.3% in that year's primary.

The reason this gets interesting is a possible split between various constituencies.
For example the Teamsters union can't be very enthusiastic about the prospect of autonomous trucks.

The bad-apple cops responsible for repeat police brutality claims are protected in their jobs by very strong unions. Who do you go with, the protestors or the police unions?

I don't know how this all plays out but it seems easier to understand if we dispense with party labels and go with a plutocrats/peasants framework.... 
Probably related:
Tesla employee calls for unionization, Musk says that’s “morally outrageous”

Thursday, October 12, 2017

Turkish Troops Invade Syria As Part Of De-escalation

Roger that, over.
From Al-Jazeera:

Turkish troops enter northern Syria in new operation
Turkish troops travelling in a convoy of 12 armoured vehicles have entered northern Syria in a new military operation.

Turkish news media reported that the vehicles carrying the troops crossed into Idlib province late on Thursday.

The development came after Turkey said it was sending troops into Syria to enforce a de-escalation zone in Idlib.

The de-escalation zone forms part of an agreement reached between Turkey, which backs forces battling the government of President Bashar al-Assad, and Iran and Russia, which support his government....MORE
 Recently:
Today's Word Is Irredentist: ""Mosul and Kirkuk are Turkish cities" - Erdogan regime begins paving its way for Iraq"

"Say Goodbye to $30 Oil as Supply Glut Is Mostly Gone, Says Platts"

OPEC might be closer to working off a supply glut than it thinks, says Gary Ross, head of global oil analytics at S&P Global Platts.

Brent crude, the global benchmark, is likely to top its 2017 high of $59.02 a barrel before the year’s end, Mr. Ross predicted speaking to reporters at a conference in New York.

“We think with the surplus stocks are mostly gone–we’re not going to see $30 oil anymore,” he said. “We’re basically in a $50 to $60 Brent world for the time being,” he said.

While he said Brent prices may rise to $60 this year, hedging by shale producers and slowing withdrawals from inventories in the first months of next year will likely limit gains.

But prices could break out of that range and trade between $70 and $80 in the next five years, Mr. Ross said. Demand is still growing and there hasn’t been enough investment in new oil projects amid languishing prices, rising U.S. shale output and worries that electric vehicles will eat into gasoline demand (something the Platts analysts don’t expect to happen for years).

“Electric vehicles and shale are the two sentiment killers– why is anyone going to invest? They’re not,” Mr. Ross said. “It sets the stage for surprises,” he added.

PIRA, an analytics and forecasting unit of S&P Global Platts, is hosting its annual client seminar in New York this week, drawing investors, executives and government leaders from around the world. While PIRA is known for frequently being bullish – Mr. Ross predicted that oil prices would top $60 in 2017 at last year’s conference, and in 2015 he predicted that oil prices would rise to $75 by this year– but it is also known for being well connected and influential. Mr. Ross spooked some traders at PIRA’s seminar in 2014 when he called for prices to fall.

Oil prices have been grinding higher in recent weeks as investors have become more confident that the efforts by major oil producers are helping to reduce a massive overhang in supply. The International Energy Agency said Thursday that “there is little doubt that leading producers have re-committed do whatever it takes to underpin the market,” and said oil supply and demand will be “roughly balanced” for most of next year....MORE

A Look Inside Google's Super-Secret Google X

From The Atlantic:

Google X and the Science of Radical Creativity
How the secretive Silicon Valley lab is trying to resurrect the lost art of invention
I. The Question
A snake-robot designer, a balloon scientist, a liquid-crystals technologist, an extradimensional physicist, a psychology geek, an electronic-materials wrangler, and a journalist walk into a room. The journalist turns to the assembled crowd and asks: Should we build houses on the ocean?

The setting is X, the so-called moonshot factory at Alphabet, the parent company of Google. And the scene is not the beginning of some elaborate joke. The people in this room have a particular talent: They dream up far-out answers to crucial problems. The dearth of housing in crowded and productive coastal cities is a crucial problem. Oceanic residences are, well, far-out. At the group’s invitation, I was proposing my own moonshot idea, despite deep fear that the group would mock it.

Like a think-tank panel with the instincts of an improv troupe, the group sprang into an interrogative frenzy. “What are the specific economic benefits of increasing housing supply?” the liquid-crystals guy asked. “Isn’t the real problem that transportation infrastructure is so expensive?” the balloon scientist said. “How sure are we that living in densely built cities makes us happier?” the extradimensional physicist wondered. Over the course of an hour, the conversation turned to the ergonomics of Tokyo’s high-speed trains and then to Americans’ cultural preference for suburbs. Members of the team discussed commonsense solutions to urban density, such as more money for transit, and eccentric ideas, such as acoustic technology to make apartments soundproof and self-driving housing units that could park on top of one another in a city center. At one point, teleportation enjoyed a brief hearing.
X is perhaps the only enterprise on the planet where regular investigation 
into the absurd is not just permitted but encouraged, and even required. 
X has quietly looked into space elevators and cold fusion. It has tried, and abandoned, projects to design hoverboards with magnetic levitation and to make affordable fuel from seawater. It has tried—and succeeded, in varying measures—to build self-driving cars, make drones that deliver aerodynamic packages, and design contact lenses that measure glucose levels in a diabetic person’s tears.

These ideas might sound too random to contain a unifying principle. But they do. Each X idea adheres to a simple three-part formula. First, it must address a huge problem; second, it must propose a radical solution; third, it must employ a relatively feasible technology. In other words, any idea can be a moonshot—unless it’s frivolous, small-bore, or impossible.

The purpose of X is not to solve Google’s problems; thousands of people are already doing that. Nor is its mission philanthropic. Instead X exists, ultimately, to create world-changing companies that could eventually become the next Google. The enterprise considers more than 100 ideas each year, in areas ranging from clean energy to artificial intelligence. But only a tiny percentage become “projects,” with full-time staff working on them. It’s too soon to know whether many (or any) of these shots will reach the moon: X was formed in 2010, and its projects take years; critics note a shortage of revenue to date. But several projects—most notably Waymo, its self-driving-car company, recently valued at $70 billion by one Wall Street firm—look like they may.

X is extremely secretive. The company won’t share its budget or staff numbers with investors, and it’s typically off-limits to journalists as well. But this summer, the organization let me spend several days talking with more than a dozen of its scientists, engineers, and thinkers. I asked to propose my own absurd idea in order to better understand the creative philosophy that undergirds its approach. That is how I wound up in a room debating a physicist and a roboticist about apartments floating off the coast of San Francisco....MUCH MORE
Previously (hmmm...maybe not super secret):

"2016 Google Tracker: Everything Google is working on for the new year" (now mit umlauts and not just in the Hästkött)
Google X's Head of Moonshots On the Future of Artificial Intelligence, Robots, and Coffeemakers
Google: "First, kill all the artisans" (GOOG)
A Long Way from Search: Google-X Team To Meet With the Food and Drug Administration (GOOG)
"Google's secret lab admits to exploring space elevator designs" (GOOG)
"Google begins launching Internet-beaming balloons" (GOOG)
The Google Barge Is Moving to Stockton (GOOG)
Google’s 10 Zaniest Projects in the 10 Years Since the IPO (GOOG)
Teach the Kids (or yourself) to Code or What is the Founder of Google-X Up To?
"San Francisco Mystery Google Barge Revealed: It's A VIP Party Boat" (GOOG)
"Android@Home, Project X, and Other Secrets of Google Inc" (GOOG)
LedgerX, The Cryptocurrency Derivatives and Swaps Platform Brought to You By Google-n-Goldman (GS GOOG)

Grains: Today's Big Dept. of Agriculture Report (WASDE)

From Inside Futures:
WHEAT: Projected 2017/18 U.S. wheat supplies are decreased modestly this month as reduced beginning stocks are partially offset by slightly higher wheat production. Beginning stocks were revised downward in the latest NASS Grain Stocks report while wheat production increased in the NASS Small Grains Annual Summary to 1,741 million bushels. Although all wheat production increased minimally from last month, the by-class changes are relatively more significant as larger Durum and Hard Red Spring production more than offset declines in Hard Red Winter and Soft Red Winter. Projected 2017/18 feed and residual is reduced 30 million bushels this month to 120 million as the NASS Grain Stocks report indicated lower-than-expected June-August disappearance. Additionally, projected 2017/18 U.S. corn supplies are the second highest on record, which is expected to dampen wheat feed and residual use for the rest of 2017/18. The other wheat use categories are unchanged this month and projected 2017/18 ending stocks are higher at 960 million bushels but still well below last years 1,181 million. The projected 2017/18 season-average farm price is unchanged this month at the midpoint of $4.60 per bushel but the range is narrowed 10 cents on each end to $4.40 to $4.80.

Global 2017/18 wheat supplies are increased, primarily on higher production forecasts for Russia, EU, and India more than offsetting a decline in Australia. Based mainly on harvest results to date, Russias 2017/18 wheat production is increased 1.0 million tons to a new record of 82.0 million tons. This is well above last years previous record of 72.5 million tons. EU wheat production is raised 2.2 million tons to 151.0 million, largely on higher production in France. Australias wheat production is reduced 1.0 million tons to 21.5 million on persistent dry conditions in most of eastern Australia. This would be Australias lowest wheat output since the 2008/09 crop year.

Foreign 2017/18 trade is fractionally higher this month as reduced exports by Australia are offset by increased exports from Canada. Projected imports are lowered for India and Turkey as increased 2017/18 production for both countries is expected to reduce import needs. Total world consumption is projected higher, primarily on greater usage by India, EU, and Russia on their increased supplies. Projected global ending stocks are nearly 5.0 million tons higher this month at 268.1 million, which is a new record.

COARSE GRAINS: This months 2017/18 U.S. corn outlook is for larger production, increased feed and residual use, and nearly unchanged ending stocks. Corn production is forecast at 14.280 billion bushels, up 96 million from last month. Corn supplies are higher, as a larger crop more than offsets a reduction in beginning stocks based on the Grain Stocks report. Projected feed and residual use is increased 25 million bushels. With supply and use changes essentially offsetting, corn ending stocks are up 5 million bushels from last month. The projected range for the season-average corn price received by producers is unchanged at $2.80 to $3.60 per bushel.

Grain sorghum production is forecast down from last month, as a 2.4-bushel per acre increase in yield to 72.2 bushels per acre is more than offset by a reduction in harvested area. Barley and oat production estimates are updated based on the Small Grains report.

Global coarse grain production for 2017/18 is forecast up 2.8 million tons to 1,319.4 million. The 2017/18 foreign coarse grain outlook is for greater production, consumption, and reduced stocks relative to last month. Foreign corn production is forecast higher, with the largest reductions for Russia, Ukraine, Ethiopia, and Tanzania more than offset by increases for a number of countries including Nigeria, Turkey, and Mozambique. The projected corn yields for Russia and Ukraine are reduced based on reported harvest results to date. Historical revisions are made to Nigerias corn, sorghum, and millet production estimates to better reflect statistics published by the government.
Corn exports are raised for Mexico and Argentina, with largely offsetting reductions for Russia and Ukraine. Argentinas 2016/17 exports are lowered for the local marketing year beginning March 2017 reflecting a slower-than-expected pace of exports to date. Projected 2017/18 food, seed and industrial use for corn in China is raised based on recent trade data indicating a higher-than-expected level of corn product exports. Foreign corn ending stocks for 2017/18 are down from last month, mostly reflecting declines for China and Mexico that are only partially offset by increases for Argentina and Turkey. Global corn stocks, at 201.0 million, are down 1.5 million from last month....MORE

Here's the last couple weeks of Chicago wheat:
And Corn

Here's the USDA's WASDE page.

Shame In China (nudge, nudge)

From Marginal Revolution:

The culture and polity that is China
Those who fail to repay a bank loan will be blacklisted, and they will have their name, ID number, photograph, home address and the amount they owe published or announced through various channels – including in newspapers, online, on radio and television, and on screens in buses and public lifts.

…In the southern city of Guangzhou, the personal details of some 141 debt defaulters have so far been displayed on screens in buses, commercial buildings and on media platforms at the request of local courts....MORE

The Big Farmland Push By Nuveen (TIAA)

We've track the investing behemoth, some links below.
From The Australian via Farmlandgrab:

Nuveen reaps rewards of steady agricultural focus
The Australian | 6 September 2017

Nuveen reaps rewards of steady agricultural focus
The purchase of more Australian farms, agribusinesses and food processing plants is high on the agenda of one of the world’s biggest investment managers, the Chicago-based Nuveen.
 
Formerly known as TIAA — the $US900 billion ($1.1 trillion) fund holding the retirement savings and superannuation assets of America’s teachers and university professors — Nuveen has long focused on the purchase of farmland and forestry reserves as a key part of its diversification strategy.
 
Nuveen’s global head of alternative asset investments, John Goodreds, visiting Australia this week to address a superannuation convention, said yesterday that farmland had become a staple of TIAA’s investment plans.
 
Nuveen owns $US6bn of farms around the world — most located in the US, Australia and Brazil — covering 700,000 ha.
 
About $US750 million has been spent buying Australian grain and cropping farms in the past decade, with Nuveen holding considerable rural assets across NSW (117,000ha), the Darling Downs in Queensland (30,000ha), Victoria’s Wimmera region (7000ha) and Western Australia’s southwest grain belt (122,000ha).
 
Its buying spree attracted particular attention in 2012 when TIAA-Westchester bought 17,200ha Cobran Station in NSW for about $18.5m to lease out to the US-owned Auscott cotton company.
 
Mr Goodreds said the business’s proven investment strategy was to mitigate and spread risk by buying farmland in geographically separate regions, to own the properties for more than 10 years and to focus on grain, grapes, fruit, vegetables and tree crop production rather than livestock.
 
A common philosophy of Nuveen — which is better known in Australian agricultural circles through its farm purchasing and management arm Westchester — is to buy the farmland and then lease it out to local farmers.
 
Mr Goodreds said the average return for Nuveen from its agricultural investments was 8-10 per cent.
 
He said there was no reason for investors — particularly Australian superannuation funds — to steer clear of owning farms purely because they were worried about the vagaries of nature and seasons.
 
“Our view is a land-based approach — very rarely do we farm ourselves — based on cropping and a globally diversified portfolio, 50 per cent of which (by value) is US farmland,” Mr Goodreds said.
 
“In our view it is very important (when investing in agriculture) to be patient capital with a long-term investment horizon — thinking in terms of 10 years plus — with (assets) in each country spread across different regions and different crop types to mitigate some of the risk in agriculture.”
 
He said the reluctance of Australian superannuation funds — which have only invested about $2.6bn of the more than $2.2 trillion of retirement savings they manage in local agriculture — was due to the time needed for thorough research....MORE
For folks who aren't as obsessive as we, here's the lowdown on the name change via MarketWatch, Jan. 23:
TIAA is one of the oldest names in the retirement industry, founded by industrialist Andrew Carnegie in 1918. But it is stepping away from that history in one part of its business as it seeks more money from outside investors.

TIAA’s asset-management unit Monday renamed itself Nuveen, taking the brand of a company TIAA purchased in 2014. The division’s dozen money managers oversee almost $900 billion in assets, ranging from stock mutual funds to timber and real estate.

TIAA in December hired Vijay Advani, former co-president at Franklin Templeton Investments, to be president and operating chief of the reorganized business....
Previously:
Sept. 2016
TIAA-CREF sub. Buys A Chunk Of Australia's Largest Wheat Grower
Aug. 2016 
Regional Fed Banks: Agricultural Credit Conditions Crumble 
Aug. 2014
TIAA-CREF Secures $1.4bn for Second Farmland Vehicle
Feb. 2013
U.S. Private Equity Betting on World Agriculture (GMO; Soros; TIAA-CREF; the usual suspects)
Aug. 2012 
Three Big Timber Deals
May 2012
TIAA-CREF Raises $2 Billion for Global Farmland Investing Company
Oct. 2010
"Is TIAA-CREF Investing In Farmland A Harbinger Of The Next Asset Bubble?"

And many more.

Weather Events In Great Britain and Ireland In the Years 750 to 999 (the Martin Rowley, booty.org.uk files)

This is the fourth of the pages from Mr. Rowley's website we were able to recover. From the introduction to this project, posted on October 7:

Dorset's own Martin Rowley spent much time and effort looking at historical weather and compiling his results at:
 http://booty.org.uk/booty.weather/climate/
In 2014 a notice appeared on his site:

IMPORTANT! For various reasons, I shall no longer be able to maintain this web site - these files will not be updated / extended as of December 2014: the site itself should remain 'active' until spring 2017 [at least] - but, if there's anything you find of interest, please take a copy for off-line reference as it may disappear at some point in the future. This site will however have a permanent archive 'home' with the British Library HERE: enter 'Booty Meteorological' in the search box.

We made note of the change and thought the database was in good hands.
Maybe not.

The British Library link goes to "https://web.archive.org/web/20170114112646/http://www.webarchive.org.uk/" which may or may not lead you to "https://www.webarchive.org.uk/ukwa/target/286294101/source/subject" which in turn offers up a couple links to the Wayback Machine's:
https://www.webarchive.org.uk/wayback/archive/20130417044152/http://www.booty.org.uk/booty.weather/
It seems the Library may have misplaced the actual data pages.

A further keyword search exposed (!) the hazards of  a URL such as www.booty.org.uk/booty.weather/, returning, among other hits a Mexican meteorologist who appears to enjoy taking her clothes off.

Because the data is a unique compilation we are going to do what we can to get it back on the internet, this time hosted on Google's (Blogger) servers but it might take some time to find what pages went where.

In defence of the British Library, they have a lot of stuff to keep track of and probably have the pages on some dusty old server down in one of the sub-basement archives. The fact the Wayback machine didn't catch the individual pages is a bit more troubling.

It would be a real shame to have the pages disappear completely.

That said, here's the only page we had that was easily found on our servers but, as indicated above I believe we have more.
Somewhere. 
Weather Events In Great Britain and Ireland In the Years 500 to 750 (the Martin Rowley, booty.org.uk files)
That was followed by:
Weather Events In Great Britain and Ireland In the Years 1000-1099 (the Martin Rowley, booty.org.uk files)
And:
Weather Events In Great Britain and Ireland In the Years 1300-1399 (the Martin Rowley, booty.org.uk files)
So here we are.

http://booty.org.uk/booty.weather/climate/751_999.htm
main historical menu
<<<<500 - 750 AD
 DateTRS Description Ref:
 751 - 999
 759/760
(Winter)
 A cold winter. (Easton, in CHMW/Lamb) [ Some accounts have this as 761 .. usual dating problems ]. 1
 763/64
(Winter
& later)
 The winter is noted as being 'severe' .. and was followed by a " long and terrible drought " .. in the spring/summer of 764: suggests abnormally persistent blocking / high pressure situation (at least, 'abnormal' in length of persistence in the same 'phase'), with the primary jet perhaps shunted well to the south. Some sources note 'great snow', with an 'intense' frost. In 'London Weather' entry, .... "one of the severest winters known in history". (Probably affected large areas of continental Europe, again suggesting a 'Scandinavian High' situation.) 1, 8
 ~770 - ~800A period of higher frequency of cold winters (note: not necessarily every winter). This leads to the suggestion of blocking of the main Atlantic, westerly flow by often slow-moving, intense anticyclones, or an increased frequency of east or northeast flow with higher pressure to the north of these islands. This would tie in to a certain extent with the idea that Scandinavian exploration / raids were assisted by lack of 'westerly-storminess'. 1
 798
(Winter)
 Ireland: snow - men & animals died. LWH
 ~800
(December)
 December 24th (original recorded as the 'Eve of Christmas', so presumably we must regard this as an 'Old Style' dating. Also, the exact year is subject to the same uncertainty as other events so long ago): gale: Great SW or W wind. Cities destroyed (!); Lamb has this comment in ref. 23: " The first recorded one of a series of storm floods .. which reduced the size of the island of Heligoland by more than half by the year 1300." LWH, 23
 804
(March)
 March 17th: Ireland - Tornado(?): thunder, wind & lightning. '1010 men killed'. [ I wouldn't normally detail all 'tornado' events, but the death-toll warrants mention, and I do wonder given that over a thousand died, whether this was in fact a 'storm' event due to a major depression rather than a small-scale tornadic event.] LWH
 817/818
(Winter)
 December 25th (assumed 817, presumably logged as 'Christmas Day'): Ireland - snow: many rivers & lakes frozen to February 22nd. [ Although only tied to Ireland, given the severity & length of the event, Britain must also have been affected. ]
[ The following from research work on Irish texts (and coupling same to major volcanic eruptions affecting the stratosphere) . . . " There was abnormal ice and much snow from the Epiphany to Shrovetide. The Boyne and other rivers were crossed dry-footed; lakes likewise. Herds and hunting-parties were on Loch Neagh, (and) wild deer were hunted. The materials for an oratory were afterwards brought by a large company from the lands of Connacht over Upper and Lower Loch Erne into [Leinster]; and other unusual things were done in the frost and hail. Epiphany is 6 January, Julian Calendar or 10 January, Gregorian Calendar. Shrovetide is a moveable feast relative to the date of Easter, occurring in later January this year. Loch Neagh and Upper and Lower Loch Erne are large Irish lakes. Source: Annals of Ulster, 818 CE.
Source: http://iopscience.iop.org/1748-9326/8/2/024035/article ]
 LWH,
(see text)
 821/822
(Winter)
 A severe winter. (Easton, in CHMW/Lamb) 1
 827 Possible severe winter. Thames frozen for nine weeks. 8,
LWH
 838
(December)
 Major North Sea storm/surge affected Dutch coastal communities; possibly the worst (known!) such storm of the 9th century, with high loss of life. [ event catalogued for Dutch coast/may not be applicable for English coast, but proximity would suggest some impact this side of the North Sea. ] GOTT
 844/845
(Winter)
 A cold winter. (Easton, in CHMW/Lamb) 1
 850
 855/856
(Winter)
 A cold winter. (Easton, in CHMW/Lamb); Great ice & frost until Jan. 7th - rivers & lakes froze.
[ From research work on Irish contemporary texts, we have the following … " much ice and frost so that the principal lakes and rivers of Ireland could be crossed by people on foot and on horse-back from the ninth of the kalends of December (27 November, AD855, Gregorian Calendar) to the seventh of the ides of January (11 January, AD856, Gregorian Calendar)' (Annals of Ulster). These conditions are clearly severe for Ireland. "; thought to be coupled to major volcanic eruption affecting the stratosphere. Ref:http://iopscience.iop.org/1748-9326/8/2/024035/article ]
 1,
LWH,
(see text)
 856 Ireland: gale: very great wind; woods felled.  LWH
 859/60
(Winter)
 A severe winter in England. 1, 8
 873/874
(Winter)
 A cold winter. (according to Easton, in CHMW/Lamb); Scotland: specifically a cold winter - great frost from November to April; thaw brought floods. 1,
LWH
 880/881
(Winter)
 A cold winter. (Easton, in CHMW/Lamb) 1
 892(?)
(November)
 11th November: Ireland - gale, many trees and houses fell.  LWH
 908 Possible severe winter. Most English rivers frozen for two months. 8,
LWH
 910 - 930 Extended droughts with regularity: also thought that the summer half-years were warm or very warm more often than not - some notably hot summers. 1
 912/913
(Winter)
 A severe winter. (Easton, in CHMW/Lamb) 1
 917
(Winter)
 Ireland: severe winter - Great snow. Lakes frozen. [ As elsewhere, implies a blocked pattern, with occasional 'Atlantic' incursions. Must have affected Britain as well I would have thought.] LWH
 923 Possible severe winter. Thames frozen for 13 weeks. Year may be 928 or 929. 8,
LWH
 927/928
(Winter)
 A cold winter. (Easton, in CHMW/Lamb) 1
 934 Katla eruption / Iceland: the severe fissure eruption in 934 was one of the largest lava eruptions in the past 10,000 years. [Possible atmospheric effects but for obvious reasons not well documented: need to do a bit more digging around on this one.] x
 939/940
(Winter)
 A cold winter. (Easton, in CHMW/Lamb) 1
 941
(Winter)
 Ireland: cold - Lakes & rivers froze. [ I wonder if this belongs to the winter noted above? ] LWH
 944 Possible severe gale/storm in London; many houses destroyed. 1500 houses "fell" (destroyed?): affected the whole of England. 8,
LWH
 946 - 948 England: drought - 'no rain for 3 years' (unlikely to have been "no" rain - more likely a marked shortage of rainfall / winter snowfall). LWH
 955
(Summer)
 Wales: Hot summer. [ Must surely have affected other parts of Britain - indeed, the heat may have been 'exceptional', if the summer was notably hot as far west as Wales.]  LWH
 973 Thames flood in London. 8
 974/75
(Winter)
 Probably a severe winter across Britain .. usual doubts about dates etc. Severe winter over whole of Europe until March 11th (OS). 1, 8, LWH
 990's Extended droughts with regularity: also thought that the summer half-years were warm or very warm more often than not - some notably hot summers. 1
 992 Ireland: Storm flood - tempest (high wind?) submerged island fort in one hour Wicklow. [ The way this is written up suggests that this was a 'storme surge' event, rather than necessarily due to heavy rain - though the latter may have played a part.] LWH
 995
(Summer)
 Summer cold throughout Europe; severe frost & ice (quite remarkable if true in July as given on this site!) LWH
 998 Possible severe winter. Thames frozen for five weeks. 8,
LWH
main historical menu
1000 - 1099>>>>

The Big Amazon Subsidy is Doomed (but they still get the $1.46 per package USPS subsidy) AMZN

The postal service subsidy is imputed (but real), more on that after the jump.

From Wolf Street: 
But for many retailers it’s too late.
Amazon battled states for years to avoid having to collect sales taxes. Walmart was on the other side of the fight, along with state revenue offices. Walmart had to add sales taxes to all its sales in California, whether online or brick-and-mortar, which at the time ranged from 7.25% to 9.75% depending on location. For shoppers, that price difference was reason enough to switch to Amazon. It was in essence a massive taxpayer subsidy for Amazon.

But Amazon lost that battle and started charging sales taxes in California in September, 2012. State after state followed. By early 2017, Amazon was charging sales taxes in all 45 states that have state-wide sales taxes and in Washington DC.

Still, even in 2016, online retailers dodged paying $17.2 billion in sales taxes on out-of-state sales, according to the National Conference of State Legislatures. For them, it’s a massive price advantage that other retailers didn’t get.

The fight over sales taxes is based on a Supreme Court case of 1992 – Quill Corp. v. North Dakota – that barred states from forcing companies to collect sales taxes if they didn’t have physical facilities in those states, such as stores or warehouses.

For Amazon, this got increasingly complicated as it is building out its distribution network, with warehouses and facilities around the country. So now Amazon is collecting sales taxes.

Problem solved? Nope.

Amazon only collects sales taxes on sales of inventory that it owns (first-party sales). But Amazon is also a platform that sells merchandise owned by other sellers (third-party sales). About half of the goods sold on the Amazon platform fall into this category. Amazon leaves sales tax collections to the 2 million merchants on its platform. But they claim that it’s not their job to collect sales taxes, and most of them don’t collect them. Hence, third-party sales still get the taxpayer subsidy.

Amazon isn’t the only out-of-state retailer or platform. It’s just the biggest one. eBay and many others are impacted by it too. Legally, this remains murky. But states and brick-and-mortar retailers are fighting to get the subsidy scrapped....MUCH MORE 
 And from Fortune, July 16:

This Analyst Claims the U.S. Postal Service Is Giving Amazon a Huge Subsidy
The 'unfair advantage' amounts to $1.46 per package. 

The U.S. Postal Service and Amazon have a special relationship. In 2013, for instance, the USPS agreed to offer Sunday delivery of Amazon packages.

But shipping industry watcher and money manager Josh Sandbulte thinks there’s an ugly underside to the USPS-Amazon collaboration. Sandbulte, writing in the Wall Street Journal last week, argued that the USPS effectively subsidizes the price of shipping Amazon’s packages.

According the Sandbulte, Congress has barred USPS from setting its parcel prices below its costs, to keep it from unfairly undercutting competitors like FedEx and UPS. But the formula for calculating those costs, set in 2006, hasn’t kept pace as packages have come to make up a higher and higher percentage of USPS volume. The law set the share of infrastructure costs associated with packages at 5.5%, but boxes now make up around 25% of Postal Service revenue.

Sandbulte cites an April analysis by Citigroup that put a price tag on the resulting distortion. If package delivery bore its fair share of Postal Service system costs, each box would cost $1.46 more to deliver. That “subsidy” is systemwide, and the USPS has courted other large e-commerce companies.

But Amazon’s size means that it benefits disproportionately, and ships around 40% of its deliveries with USPS. In Sandbulte’s view, this means the Postal Service is “picking winners and losers in the retail world.”

But Sandbulte’s investment firm holds FedEx stock, meaning he has a direct interest in critiquing the USPS, and his analysis is debatable on several points. He disingenuously describes the pricing situation as “a gift card from Uncle Sam,” which implies there’s tax money involved. But the USPS doesn’t receive tax revenues.

Additionally, USPS’s legal duty to provide universal service means that even at a discount, shipping boxes for Amazon helps it generate revenue from potentially unused capacity. Fixed costs aside, USPS package delivery is profitable, helping subsidize rural service and letter delivery. So there’s room for disagreement about whether the situation is actually unjust.

Amazon issued the following statement in response to Sandbulte’s claims: “As is the case with all of its customers, our partnership with USPS is reviewed annually by the Postal Regulatory Commission, which has spent decades reviewing and approving USPS costing and pricing practices....MORE
FreightWaves—"FreightTech is the new FinTech"—has more detail.

The Rate of Growth of Central Bank Balance Sheets Is Rapidly Decelerating

From The Macro Tourist, October 5: 

GOOD THING JESSE ISN'T AROUND TO SEE THIS
Think back six months. Do you remember all the warnings from the legendary hedge fund managers about the impending stock market doom? Paul Tudor Jones, Scott Minerd, Larry Fink, Seth Klarman, the list is long but distinguished. At the time I penned It’s too easy to write bearish pieces. Even in late summer, gurus like Gundlach were bragging about the 400% he would make on his S&P 500 put purchases - Billionaire Bears. Given the atmosphere, I knew posts about the coming collapse would be greeted with tons of words of encouragement. Yet if I wrote something about the stock market continuing higher, crickets… Or worse yet, remarks about my cluelessness regarding the problems in the global financial system. I didn’t think stocks were going higher because everything was roses, no in fact just the opposite. Stocks were being pushed higher because everything was so FUBAR’d. Central Bank balance sheet expansion was pushing risk assets higher, and for the longest time, everyone wanted to fade it.

Fast forward to today. Even the most ardent bears have given up and embraced the idea Central Bank buying will push stocks higher. Investors that were previously doom and gloomers are now speaking of blow off-tops. I can hear the capitulation in their voices. No more brave predictions of the coming collapse. Instead, meeker forecasts of a high volume runaway euphoria. There are no bears left. None. Not a soul.

The bears have been replaced by gloating bulls that are openly bragging about how high the S&P 500 futures will gap up Sunday night. They are mocking the bears with taunts of how much money will they lose fighting the rally. They joke about buying the dip, which increasingly is becoming more and more nothing more than a couple of downticks.

I might not know much, but I know the Market Gods do not take kindly to that sort of behaviour. What was that quote from Bernard Baruch? “The main purpose of the stock market is to make fools of as many men as possible.”

Ask yourself what would embarrass most investors right now? Would it be a continuing rally? Not a chance. Given the white flag waving by the bears, and the over-enthusiasm of the bulls, there is little doubt in my mind that a stock market decline is what would hurt most. That wasn’t the case six months ago. Heck, it wasn’t even the case two months ago. But that’s where we are today.
I could try to dig up some sentiment numbers, but the reality is I don’t need to. The mood is plainly obvious. Investors are as bullish as they have ever been since the Great Financial Crisis. Sure, you might argue that it was much more frothy in 1999. But who cares? Do you really want to be buying based on the greater fool theory? Ask Chuck Prince how that turned out.

It’s hard standing alone and fighting the crowd. If it was easy, everyone would do it.
I have written about the new reality of how markets are now full of A Series of Rolling Mini-Bubbles, but a sharp Seeking Alpha writer by the name of Ian Bezek has done a better job than me of identifying the latest madness. In his post, An ETF Levitates: This is Not Normal, Ian points out that the IWC nano-cap ETF has been up 26 of the past 28 days.
This is the new reality. A series of rolling mini-bubbles. But you want to know the hardest part? Just when it looks best, is the time to fade it.

I can already hear you saying to yourself, that’s a big leap. Selling it because it looks good? Well, in case you don’t believe me about the series of rolling mini-bubbles (remember, the keyword is mini), how about this for a reason?

Almost everyone has now embraced the idea that Central Banks will push asset prices to the moon. It’s like they just realized that with the balance sheet expansion of the ECB, BoJ and the SNB (Swiss National Bank), the monetary stimulus has been higher than any time except for the initial days of the crisis.
One thing before I continue. For these Central Bank balance sheet charts, I have frozen the currency adjustments in time. If I let them float, then the balance sheet size will move around as the US dollar rises or falls. Since we are interested in how much the Central Banks are expanding or shrinking their balance sheets, this would lead to a distorted monthly change.

Let’s zoom in and have a look at this a little bit more closely.


...MUCH MORE

Wednesday, October 11, 2017

"Fed Minutes: December Rate Hike Depends on Inflation"

From Barron's Income Investing:
"December Fed hike not a gimme put," is the headline that Torsten Sløk of Deutsche Bank Securities put on his report on the Fed minutes.

At the September meeting of the Federal Open Market Committee, officials were in agreement that the economy is healthy, but they were mixed in their outlook for inflation.

Some members indicated they don't favor more hikes until the inflation outlook is clear. That gave the minutes a slightly dovish cast that interest rate strategists weren't expecting.

"December Fed hike not a gimme put," is the headline that Torsten Sløk of Deutsche Bank Securities put on his report. He called the minutes, "confusing and inconsistent."

Bryce Doty of Sit Fixed Income Advisors thought it was understandable. If inflation rebounds, the Fed will seem to be "behind the curve" while if it stays low and the Fed hikes, it will seem it was too aggressive. "Understandably, the minutes suggest there is not a consensus amongst Fed members on when to best raise rates again," he says.

Below is one example from the minutes of a passage with some dovish elements:
With the medium-term outlook little changed, inflation below 2 percent, and the neutral rate of interest estimated to be quite low, all participants thought it would be appropriate for the Committee to maintain the current target range for the federal funds rate at this meeting, and nearly all supported again indicating in the postmeeting statement that a gradual approach to increasing the federal funds rate will likely be warranted. Nevertheless, many participants expressed concern that the low inflation readings this year might reflect not only transitory factors, but also the influence of developments that could prove more persistent, and it was noted that some patience in removing policy accommodation while assessing trends in inflation was warranted....
...MORE

"Is Dalio's Bridgewater A Fraud? Here Are The Troubling Questions Posed By Jim Grant"—UPDATED II

Update II: "Matt Levine: "The Case Against Bridgewater Isn't Proven""

Update: Bad link fixed. 

From ZeroHedge:
Jim Grant, author of Grant's Interest Rate Observer, first hinted last week that not all is well when it comes to the world's biggest hedge fund, Ray Dalio's $160 billion Bridgewater (of which one half is the world's biggest risk-parity juggernaut). Speaking to Bloomberg last week, Dalio said he was "bearish" on Bridgewater because founder Dalio has become "less focused on investing, while the firm lacks transparency and has produced lackluster returns."
Grant slammed Dalio's transition from investor to marketer, and in a five-page critique of the world’s largest hedge fund, said Dalio has been preoccupied with his new book, sitting for media interviews and sending Tweets.
“Such activities have one thing in common: They are not investing,” Grant writes in the Oct. 6 issue of his newsletter. “Yet here he is, laying it all out to the world again, Tweeting, promoting his book, attacking the press -- necessarily doing less of his day job than he would otherwise do.”
Grant continued his scathing critique, accusing Bridgewater of "lately performed no better than the typical hedge fund.” Grant is right: since the start of 2012, Bridgewater’s Pure Alpha II Fund has posted an annualized return of 2.5% vs its historic average of 12%, and is down 2.8% this year through July.
The underperformance may be explainable: after all the polymath billionaire has been busy opining in recent months on subjects from the rise of populism to his affinity for China, "which are distraction from making money" Grant said.
But if Grant had limited himself to merely Dalio's stylistic drift, it would be one thing: to be sure, the fund's billionaire founder may simply have lost a desire to manage money and has instead discovered a flair for writing books and being in the public spotlight.
However, Grant - or rather his colleague Evan Lorenz - went deeper, and as he writes in the latest Grants letter, he raises several troubling points, which go not to the hedge fund's recent underprofmrance - which can be perfectly innocuous -  but implicitly accuse the world's biggest hedge fund of borderline illegal activities and, gasp, fraud. Some of the more troubling points brought up by Lorenz are the following:
  • Bridgewater has directly lent money to its auditor, KPMG, to which KPMH's response is that “these lending relationships . . . do not and will not impair KMPG’s ability to exercise objective and impartial judgment in connection with financial statement audits of the Bridgewater Funds.”
  • Bridgewater has 91 ex-employees working at its custodian bank, Bank of New York.
  • Only two of Bridgewater's 33 funds have a relationship with Prime Brokers. In these two funds, Bridgewater Equity Fund, LLC and Bridgewater Event Risk Fund I, Ltd., 99% of the investors are Bridgewater employees.
  • Opaque ownership concerns: "Two entities—Bridgewater Associates Intermediate Holdings, L.P. and Bridgewater Associates Holdings, Inc.—are each noted as holding 75% or more of Bridgewater."
  • Why the massive, and expensive, ETF holdings: "The June 30 13-F report shows U.S. equity holdings of $10.9 billion. The top-16 holdings, worth $9.5 billion, or 87% of the reported total, come wrapped in ETFs, including the Vanguard FTSE Emerging Markets ETF, the SPDR S&P500 ETF Trust and the iShares MSCI Emerging Markets ETF. Beyond the fact that Bridgewater reports holding few U.S. equities, you wonder why such a sophisticated shop would stoop to such a retail stratagem. Surely the Bridgewater brain trust could replicate the ETFs at a fraction of the cost that the Street charges."
  • And perhaps most troubling, is the SEC in cahoots with Bridgewater? "Lorenz asked the SEC how Bridgewater’s answers comply with the requirement to “[p]rovide your fee schedule.” Via email, the agency replied, “Decline comment, thanks.”
And so on. There is much more in the full Grant's note, transcribed below which everyone who has even a passing interest in Bridgewater should read (and of course subscribe to Grant's, which together with 13-D, are the two best newsletters on Wall Street).
* * *
The face on the Wall Street milk carton
Ray Dalio, founder, chairman and co-chief investment officer of Bridgewater Associates, L.P., is going public—personally. He has written a book, given a TED talk, sat for interviews, dueled with journalists (or, as he styles them, “journalists”) and paid money—actually paid—to promote his tweets. Such activities have one thing in common: They are not investing....
...MUCH MORE

EIA October 2017 Short Term Energy Outlook (STEO)

From the U.S. Energy Information Administration:
Release Date: October 11, 2017

Forecast Highlights
Winter Fuels Outlook
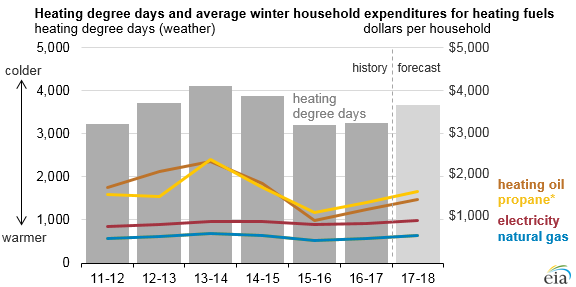
  • EIA forecasts that average household expenditures for all major home heating fuels will rise this winter because of expected colder weather and higher energy costs. Average increases vary by fuel, with natural gas expenditures forecast to rise by 12%, home heating oil by 17%, electricity by 8%, and propane by 18%. Most of the increase reflects expected colder weather rather than higher energy costs. A warmer-than-forecast winter would see lower increases in expenditures, and a colder-than-forecast winter would see higher increases in expenditures (Winter Fuels Outlook).
Global liquid fuels
  • North Sea Brent crude oil spot prices averaged $56 per barrel (b) in September, an increase of $4/b from the average in August. EIA forecasts Brent spot prices to average $52/b in 2017 and $54/b in 2018, which is $1/b higher in 2017 and $2/b higher in 2018 compared with last month's forecast. West Texas Intermediate (WTI) average crude oil prices are forecast to be $3.50/b lower than Brent prices in 2018. NYMEX contract values for January 2018 delivery that traded during the five-day period ending October 5 suggest that a range of $40/b to $65/b encompasses the market expectation for January WTI prices at the 95% confidence level.
  • After reaching a two-year high of $2.69 per gallon (gal) on September 11, U.S. regular gasoline retail prices fell to an average of $2.57/gal as of October 2, as U.S. refinery capacity and gasoline production gradually came back online following Hurricane Harvey. EIA forecasts the U.S. regular gasoline retail price will average $2.49/gal in October and fall to an average of $2.33/gal in December.
  • U.S. crude oil production is estimated to have averaged 9.3 million barrels per day (b/d) in September, an increase of about 250,000 b/d from the August average. Crude oil production in the Gulf of Mexico is estimated to have increased to a monthly average of 1.7 million b/d in September, following Hurricane Harvey, an increase of 70,000 b/d from the August level. EIA forecasts total U.S. crude oil production to average 9.2 million b/d in 2017 and 9.9 million b/d in 2018, which would mark the highest annual average production in U.S. history, surpassing the previous record of 9.6 million b/d in 1970.
Natural gas
  • U.S. dry natural gas production is forecast to average 73.6 billion cubic feet per day (Bcf/d) in 2017, a 0.8 Bcf/d increase from the 2016 level. Natural gas production in 2018 is forecast to be 4.9 Bcf/d higher than the 2017 level.
  • In September, the average Henry Hub natural gas spot price was $2.98 per million British thermal units (MMBtu), up 8 cents/MMBtu from the August level. Expected growth in natural gas exports and domestic natural gas consumption in 2018 contribute to the forecast Henry Hub natural gas spot price rising from an annual average of $3.03/MMBtu in 2017 to $3.19/MMBtu in 2018. NYMEX contract values for January 2018 delivery that traded during the five-day period ending October 5 suggest that a range of $2.28/MMBtu to $4.63/MMBtu encompasses the market expectation for January Henry Hub natural gas prices at the 95% confidence level.
Electricity, coal, renewables, and emissions
  • EIA expects the share of U.S. total utility-scale electricity generation from natural gas to fall from 34% in 2016 to about 31% in 2017 as a result of higher natural gas prices and increased electricity generation from renewables and coal. In 2018, natural gas's generation share is expected to rise to 32%. Coal's forecast generation share rises from 30% last year to 31% in 2017 and is expected to stay at that level in 2018.
  • U.S. coal production for September 2017 was an estimated 66 million short tons (MMst), up 1 MMst (1%) from September 2016. Coal production for the first nine months of 2017 was 591 MMst, 62 MMst (12%) higher than in the same period in 2016. Coal production is expected to increase by 8% in 2017 and by less than 1% in 2018.
  • Coal exports for the first seven months of 2017 totaled 51 MMst, which was 62% higher than in the same period of 2016. EIA expects growth in coal exports to slow, with exports for all of 2017 forecast at 75 MMst, 15 MMst (24%) higher than the 2016 level.
  • U.S. wind electricity generating capacity at the end of 2016 was 82 gigawatts (GW). EIA expects wind capacity additions to bring total wind capacity to 88 GW by the end of 2017 and to 96 GW by the end of 2018.
  • Total U.S. utility-scale solar electricity generating capacity at the end of 2016 was 22 GW. EIA expects solar capacity additions to bring total utility-scale solar capacity to 27 GW by the end of 2017 and to more than 30 GW by the end of 2018. Generation from small-scale solar (installations less than 1 megawatt) is expected to increase by 28% in 2017 and by 23% in 2018.
  • After declining by 1.7% in 2016, U.S. energy-related carbon dioxide (CO2) emissions are projected to decrease by 0.6% in 2017 and then to increase by 2.2% in 2018. Energy-related CO2 emissions are affected by changes in weather, economic growth, and energy prices.
...MUCH MORE

Earlier today:
EIA: "Winter heating costs likely to be higher this winter than last winter" 

High-End New York Residential Asking Prices Coming Down (including David Rockefeller's place)

From The Real Deal, Oct. 10:

The biggest price cuts on luxury pads

https://s14.therealdeal.com/trd/up/2017/10/288358275-1.jpg
get a price check on the East Side?

From East 53rd Street all the way up to East 69th, owners of luxury apartments are karate-chopping asks, according to data provided by StreetEasy. In fact, all of the largest price cuts this week were seen in just a 16-block section of Manhattan’s East Side.

Here’s a look at the biggest price reductions:
*****
16 Sutton Square
Previous Price: $29.9 million
Current Price: $24.5 million
Percentage Drop: 18 percent
This townhouse overlooking the East River was once owned by Greek shipping magnate Aristotle Onassis and later by philanthropist John Whitehead. It was rebuilt and renovated, but still has oodles of old New York prestige.
******
146 East 65th Street
Previous Price: $32.5 million
Current Price: $27 million
Percentage Drop: 17 percent
You might have heard of this Lenox Hill townhouse. It is, of course, the late David Rockefeller’s former home. Weighing in at 9,777-square-feet and 21 rooms, this house affords lost of space for activities – now at a discount....
....MORE
****** 
When the Rockefeller townhouse came on the market at $32.5 million Mansion Global mentioned:
...Despite the cachet of the property’s last owner, a billionaire banker who once controlled Chase Manhattan Bank and wielded wide influence in New York and around the world, the asking price is below the top prices at which Upper East Side townhouses have traded over the last decade because of its location and condition....
It does look a bit dowdy but hey, Mr. Rockefeller was 101 when he died and probably not all that interested in upgrades the last five years or so.

Via Curbed, June 9:

https://cdn.vox-cdn.com/thumbor/sv-q1BsiTTRLqt_IW3kkAkOZd4k=/0x0:1400x933/920x613/filters:focal(588x355:812x579)/cdn.vox-cdn.com/uploads/chorus_image/image/55178749/146East65thSt_TH_LivingRoomFireplace2blur_ch.0.jpg


https://cdn.vox-cdn.com/thumbor/myC7Lp2OBgUq4kX8cNdC4l4Fyrs=/1000x0/filters:no_upscale()/cdn.vox-cdn.com/uploads/chorus_asset/file/8660077/146East65thSt_TH_DiningRoomReverseBLUR2_ch.jpg

Possibly of more interest to our readers is the art collection which will hit the block next year.

"We have an ingrained anti-profit bias that blinds us to the social benefits of free markets"

Thus sayeth the shrinks.
From the British Psychological Society's Research Digest, August 4, 2017:

https://researchdigest.files.wordpress.com/2017/08/gettyimages-1538307.jpg?w=845
“Harnessing the ‘base’ motive of material self-interest to promote the common good is perhaps the most important social invention mankind has yet achieved,” said the American economist Charles Schultz. And you can see why. While acknowledging its problems, many credit free market capitalism for the dramatic reduction over recent decades in the proportion of people in the world living in extreme poverty, not to mention rising health standards and technological advances. Conversely, according to some commentators, one only has to look to modern-day Venezuela to see the dangers of extreme anti-profit socialism.

And yet, according to a new paper in Journal of Personality and Social Psychology, most of us have an instinctual anti-profit bias. We view for-profit companies and industries – upon which capitalism is based – with inherent distrust, assuming that the more profitable they are, the more harm they do to society. In fact, research shows the opposite is true: companies that make greater profits actually tend to contribute more value to society, for example in terms of their environmental responsibility and corporate philanthropy.

The authors of the new paper, led by Amit Bhattacharjee at Erasmus University, believe this anti-profit bias leads many voters and politicians to endorse anti-profit policies that are likely to lead to the very opposite outcomes for society that they want to achieve. “Erroneous anti-profit beliefs may lead to systematically worse economic policies for society, even as they help people satisfy their social and expressive needs on an individual level” they said.


Through seven separate studies involving hundreds of online participants, the researchers present evidence that the anti-profit bias arises because we think about for-profit motives in a somewhat superficial, ego-centric fashion. Because the desire for profit is seen as based on selfish intent, we extrapolate to assume that the activities of for-profit companies and industries must be bad for society, disregarding the reality that selfish intents can have positive consequences.

We also refer to our own mundane “zero sum” experiences, such as buying a car, in which the seller’s profitable gain inevitable comes at our loss. We fail to consider how market forces operate on a massive scale, in which for-profit companies (competing in a free market with informed customers) need to innovate, behave fairly and develop a good reputation in order to be profitable over the long term.

For instance, in the first study, participants rated Fortune 500 companies in terms of how profitable they thought they were and how much they thought they engaged in bad business practices, such as operating at the expense of others with no concern for society. There was a clear pattern: the more profitable participants thought a company was, the more they assumed that it engaged in more bad business practices. In fact expert assessments of the firms shows the opposite pattern....MORE

EIA: "Winter heating costs likely to be higher this winter than last winter"

We'll be back with the STEO later today but for now, a taste.
From the Energy Information Administration's Today in Energy, October 11:
graph of heating degree days and average winter household expenditures for heating fuels, as explained in the article text
Source: U.S. Energy Information Administration, Short-Term Energy Outlook, Winter Fuels Outlook, October 2017
Note: Propane price is the weighted average of Midwest and Northeast prices. All other fuels reflect national averages.

Most U.S. households can expect higher heating expenditures this winter (October through March) than the last two winters according to EIA's Winter Fuels Outlook, which will be released at 11:00 a.m. today. Higher expected winter heating expenditures are the result of both more heating demand because of relatively colder weather and, to a lesser extent, higher fuel prices.

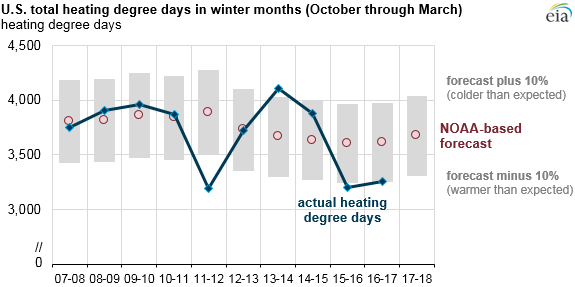
EIA’s projections of heating demand are based on the most recent temperature forecasts from the National Oceanic and Atmospheric Administration (NOAA). NOAA’s forecast anticipates that winter weather will be 13% colder than last winter and closer to the average of the previous 10 winters.
Because weather patterns present great uncertainty to winter energy forecasts, EIA's Winter Fuels Outlook includes projections for 10% colder and 10% warmer scenarios. In the past 10 winters, actual temperatures have been more than 10% colder than NOAA’s September forecast once and warmer than the forecast twice.
graph of U.S. total heating degree days in winter months, as explained in the article text
Source: U.S. Energy Information Administration, Short-Term Energy Outlook, Winter Fuels Outlook, October 2017

The average household winter heating fuel expenditures in EIA’s forecast provide a broad guide to expected heating expenditures. Fuel expenditures for any household also depend on the size and energy efficiency of the home and its heating equipment, indoor temperature preferences, and local weather conditions.

The choice of primary heating fuel varies considerably by region, resulting in regional differences in total expenditures. Natural gas is the most common space heating fuel in every region except the South, where electric heating is more prevalent. Heating oil is much more common in the Northeast than in other regions, while propane is more common in the Midwest.
map of primary home heating fuel by state, as explained in the article text
Source: U.S. Energy Information Administration, based on Census Bureau American Community Survey 2016

...MORE

The Impossibility Of Some Electric Vehicle Dreams

Yesterday I promised to post something on why Amazon can't really be serious about the patents in "Amazon Energy? Amazon Looks To Deploy Drones To Recharge Electric Cars And Other Vehicles".

Before proceeding I would urge anyone with an interest in energy to look at the post "Energy and Artificial Intelligence Expert Professor Sir David J.C. MacKay Has Died, Age 48" in particular the discussion of his book "Sustainable Energy - Without the Hot Air". He thought the topic important enough to post a free version of the little volume. Here's his Cambridge Uni -Cavendish Laboratory - webpage with some stuff from the days before the Queen made him a Regius Professor.

And for a quick look at the facts of electricity and charging away from home, Driving Canada's Motor Mouth column, October 6:

Motor Mouth: More inconvenient truths on banning gas engines
High-speed EV recharging stations on highways sound great – until you hear how much they would cost 
Anyone who tells you that the electric car in your future will be just as convenient as the gasoline-fueled vehicle you’re currently driving is lying. If not overtly, then at least by omission. Nor can they plead ignorance, the calculations required to reach this conclusion hardly the stuff of graduate-level physics. Indeed, judging from the experts I’ve spoken with, plenty have been the warnings proffered to the politicians, policy makers and futurists advocating an all-battery-powered future.

Now before you go all Tesla on me and start putting angry pen to paper, let me give credit where credit is due. In an emissions-free automotive world, the electric vehicle is king of the inner-city commute: the ability to recharge at home — during off-hours, minimizing the load on our grids — is convenient, their torquey motors perfect for the point and shoot of inner-city traffic, and their range more than what is needed by 90 per cent of commuters. I also trust that battery technology will get lighter and more energy dense so the 100+ kilowatt-hour batteries of the future won’t all weigh a thousand pounds. Nor is the tired old bugbear — “all that electricity is being generated by coal” — likely to be a problem in 20 or 30 years, the cost of renewables hopefully coming down to a manageable level.

Instead, the problem for our all-electric future (now California is said to be following France and England’s banning of the internal combustion engine) is power transmission. More specifically, as one industry expert summed up the situation, “the bottleneck [clouding the future of the electric vehicle] is local distribution.” That bottleneck is going to be the highway service stations that will be required to service our 300 million now-electric cars for longer trips when we don’t have access to the convenience of our home chargers.

Consider the following scenario: last Labour Day weekend, like so many holiday weekends, pretty much every fuel pump on the side of Ontario’s 401 was, er, pumping non-stop. That, for anyone thinking of following along with my calculus, is a station every 80 kilometres, each with up to 16 pumps. More importantly, each of those is capable of pumping about 30 litres of gasoline in a minute. In other words, discounting credit card transaction and unscrewing of gas cap, even the most ardent gas-guzzler can take in enough fossil fuel for 500 kilometres of driving in about two minutes.
But consider this: an EV that can guarantee 500 klicks requires at least 100 kilowatt-hours of battery. Do the math and a similar two-minute recharge would require three megawatts. That, for those who don’t have an electrical engineering degree, is 3,000 kilowatts.

Now for some perspective: current fast chargers boast about 50kW. Yes, essentially 1/60th of the charging capacity required to match the refueling rate of an everyday gas-powered car. If you’re reaching for your calculator, I’ll save you the trouble: Serving the same number of cars could theoretically require as many as 960 charging stations (and they’d still have to sit there for two hours to fully charge).

But isn’t Porsche promising a 20-minute charge for 400 kilometres of range, you ask? Doesn’t that mean we’ll soon see EVs capable of matching those two-minute recharges?

Well, yes, Porsche is making just such a promise. Unfortunately, however, that would seem to be the practical limit of how fast we’re going to be able to recharge these electrical behemoths. Indeed, The 350kW rechargers required for those promised 20-minute refueling is, according to the experts I spoke with, likely the upper limit of the equipment we humans will ever be allowed to handle. In fact, these 350kW rechargers generate so much heat, their amperage is so incredibly high, that the cables carrying all that current need to be liquid cooled. And anything that can recharge our batteries faster than 20 minutes will have to be automated, i.e., phantasmagorically expensive.

How expensive? As I mentioned, you’ll need about 60 50kW rechargers to replace one fuel pump; about eight of the 350kW variety for every pump. That, as I mentioned, would mean 960 of the low-powered 50kW units at each rest stop and 128 of the high-tech 350kW versions. Have I mentioned that even those low-powered 50kW fast chargers cost about $40,000 apiece? One of those faster-charging 350kW items? About two hundred large. Faster-charging automated versions would cost upward of a half-million each.

Even a more conservative estimate taxes one’s calculator. Factoring in the aforementioned credit card transaction and washing of windshield that might extend gasoline refueling to five minutes, it would still require 600 of those 50kW chargers for a roadside station to service the 2,000 cars those gas pumps could service in a busy 12-hour period. Even that conservative estimate would require a $24-million investment just for the cheapest rechargers.

They’d also need about 30 megawatts of power. For those thinking that’s a sh%$-load of electricity, you’re right. Thirty megawatts, for perspective, is enough to power about 20,000 homes. In other words, powering these service stations of the future will require about the same amount of electricity as a city of 75,000. Oh, and by the way, all that electricity, unlike off-hour home recharging, happens during peak-usage daylight hours.

In other words, all that extra power, at least for intra-city travel, will have to come from new — not existing — sources. At the most optimistic prices posited for the future cost of solar panels — about a buck a watt — that’s another $30 million. If you want to go the windmill route, you’ll need 10 of them, each costing roughly $4 million. Just as further reminder, that’s for each and every roadside station. And for those thinking there may be some breakthrough in the future that will allow faster recharging, know that while battery technology is in its infancy, electricity generation is a mature technology and the laws of power transmission are likely to remain pretty much immutable....MUCH MORE