People are taking datapoints from the CPI report to bolster arguments for preexisting mindsets and I suppose I am too, though that sort of introspection is fraught with the same blind spots that lead to the preexisting mindsets in the first place.
The wonderful thing about the monthly BLS reports is that you can pick and choose from a truly amazing array of data and if the data doesn't fit the political argument you want to make you can slice it and dice it and massage it until it does. One of the funnier examples was seen in October last year:
The war on inflation is over. We won, at very little cost pic.twitter.com/opumf3nEvL
— Paul Krugman (@paulkrugman) October 12, 2023
And on that note we begin a not-so-light-hearted romp through the numbers.
From Wolf Street May 15:
Month-to-month data is volatile. We’ll look at the trends.
After months of worsening data on CPI inflation, we got still bad, but less bad, data today for April by the Bureau of Labor Statistics. And perhaps it was just another month-to-month squiggle, to be turned around over the next few months, of which we had many. Or perhaps it was a change in trend.
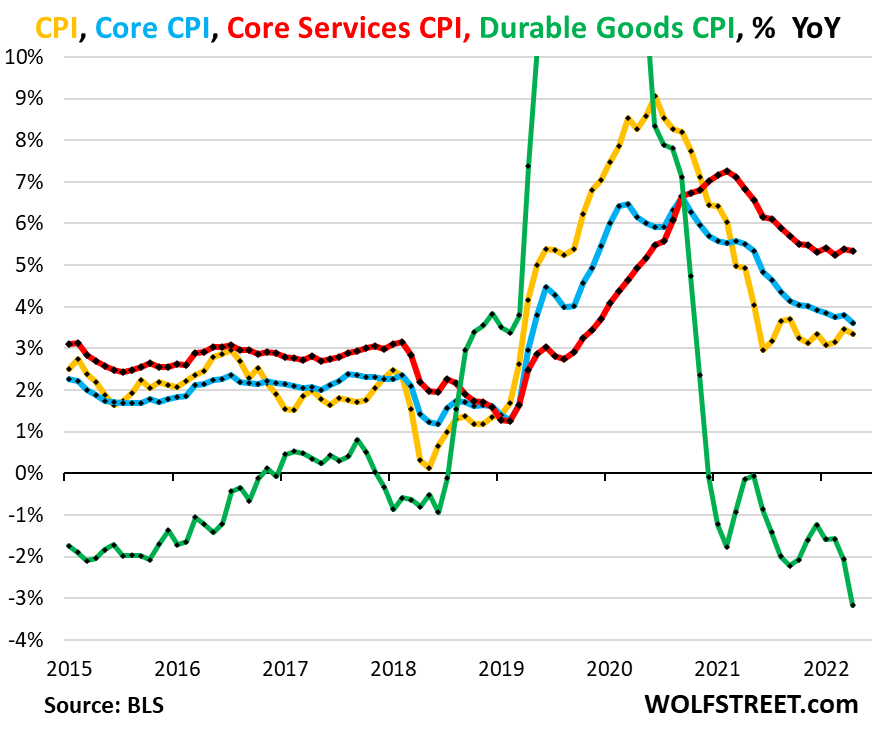
We’ll get to the details in a moment. But in summary, on a year-over-year basis:
Core services CPI – which accounts for about 60% of total CPI – increased by 5.3% year-over-year in April, roughly the same hot pace for the seventh month in a row, and seems to have gotten stuck there (red line).
Durable goods CPI – which had horribly spiked during the pandemic, including by 19% in December 2021 – has been falling by every measure across the board since mid-2022, led by the plunge in used-vehicle prices. In April, durable goods CPI was down 3.2% year-over-year (green).
Core CPI, which excludes food and energy, decelerated a tad to a 3.6% pace (blue line), slowed by the sharp drop in durable goods.
Overall CPI increased at essentially the same pace as in March, by 3.4% (yellow line), with the energy CPI up 2.6% and the food-at-home CPI up 1.1%:
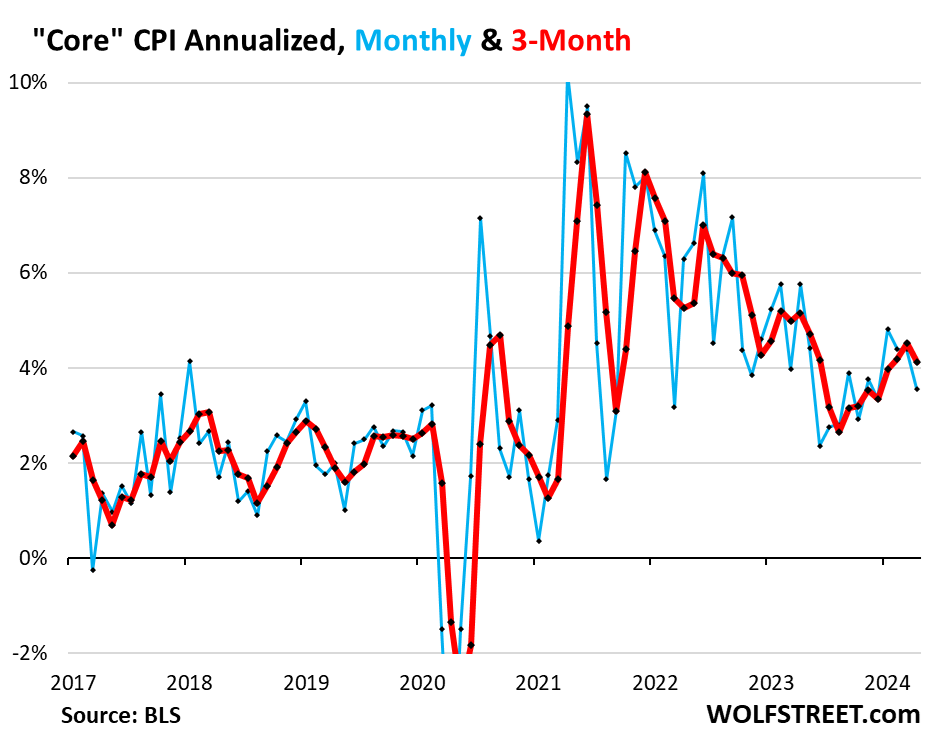
Trends in Core CPI.
The month-to-month changes zigzag up and down, as you can see in the blue line in the chart below, representing month-to-month changes annualized. On this annualized basis, core CPI rose by 3.6% in April from March.
The three-month core CPI, which irons out some of the zigzags, rose by 4.1% annualized, a slower increase than in the prior month:
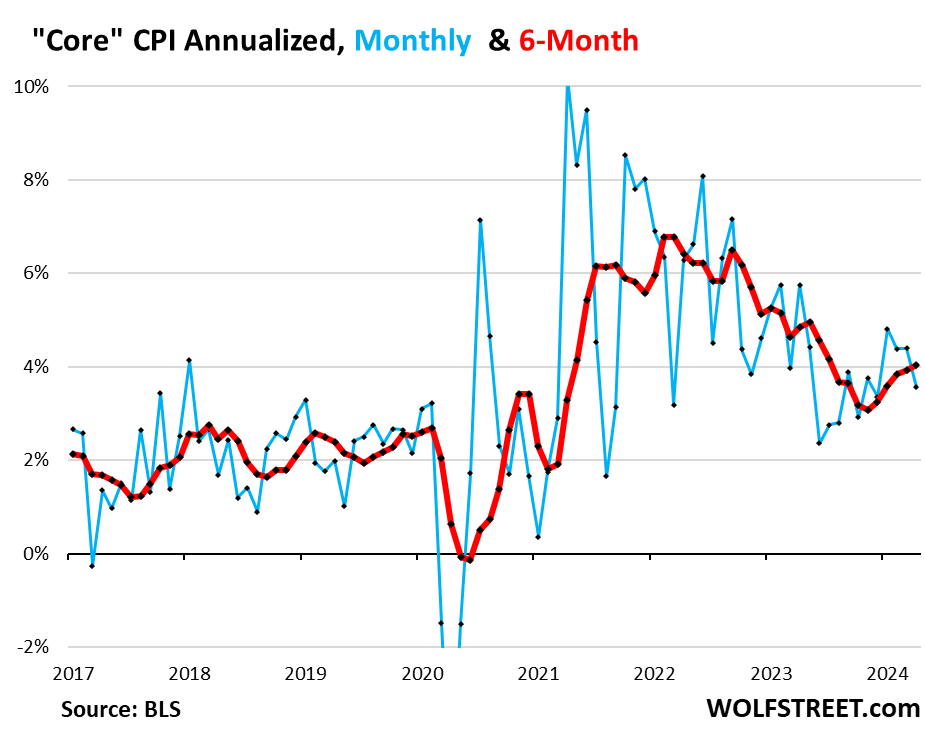
But the six-month core CPI, which irons out most of the month-to-month zigzags, and which Powell often cites, accelerated to 4.0% annualized, the biggest increase since July, and the fifth month in a row of increases:
Trends in core services inflation.
Core services CPI increased by 5.1% annualized in April from March, so that was hot, but it was less hot than the prior three month-to-month increases that ranged from 5.6% to 8.2%.
The blue line, which shows the month-to-month changes annualized, goes up one month and down the next, and this month was a down-month.
The three-month average core services CPI – now February, March, and April – decelerated to an increase of 5.7% annualized as the January reading of 8.2% dropped out of it.
But the six-month core services CPI, which irons out the month-to-month squiggles fairly well, continued to accelerate and reached 6.0%, the highest since May 2023, back when it was on the deceleration path:....
....MUCH MORE