Expected by whom?*
Here's the release at the Bureau of Labor Statistics.
And from ZeroHedge, January 11:
Headline Consumer Price Inflation printed hotter than expected in December, +0.3% MoM vs +0.2% exp and +0.1% prior, pushing the YoY headline CPI up to +3.4% (from +3.1% prior and hotter than the +3.2% exp)...
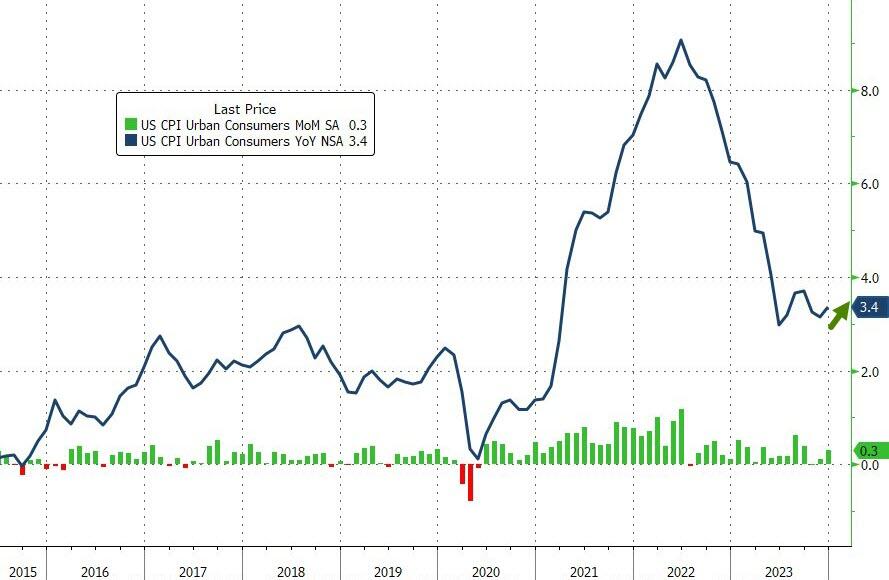
Source: Bloomberg
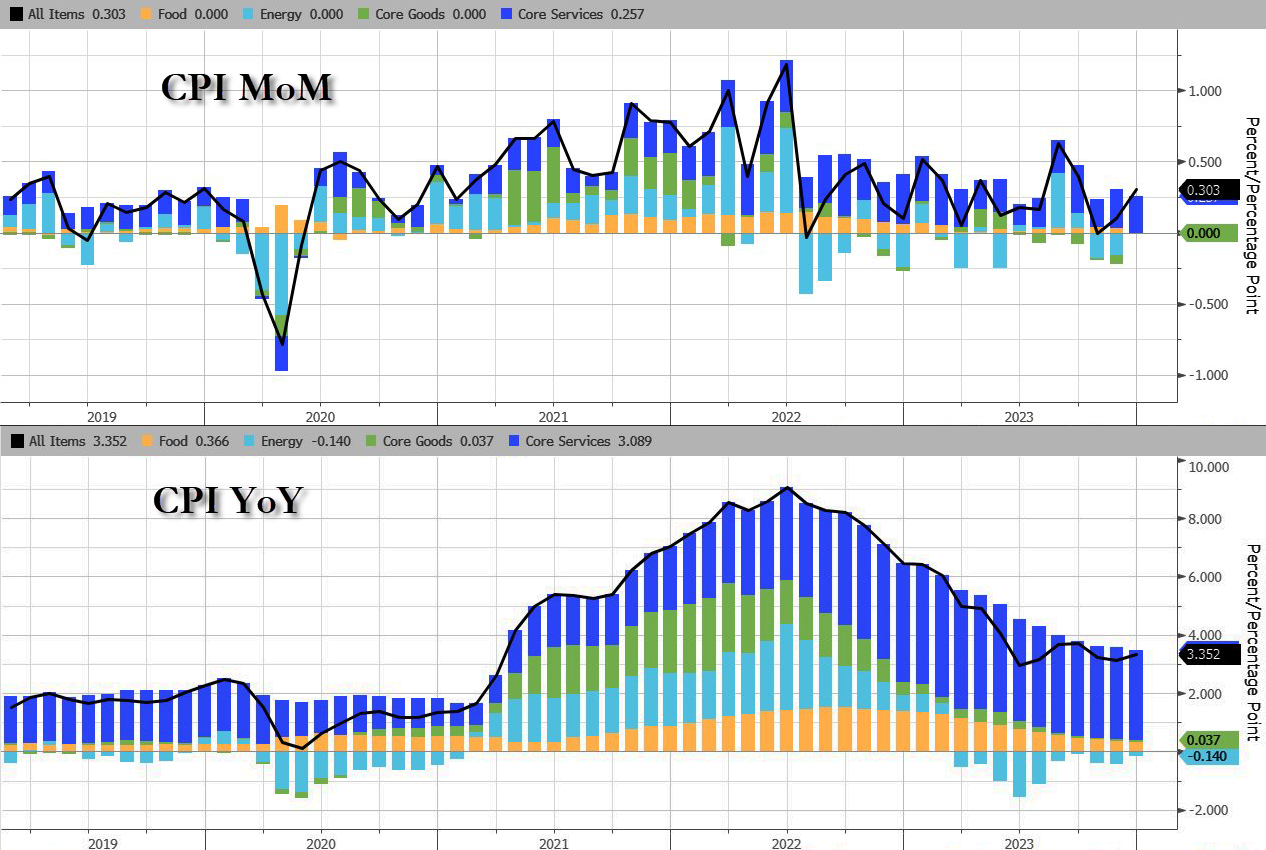
Services (Shelter mostly) costs re-accelerated and energy deflation stalled in December...
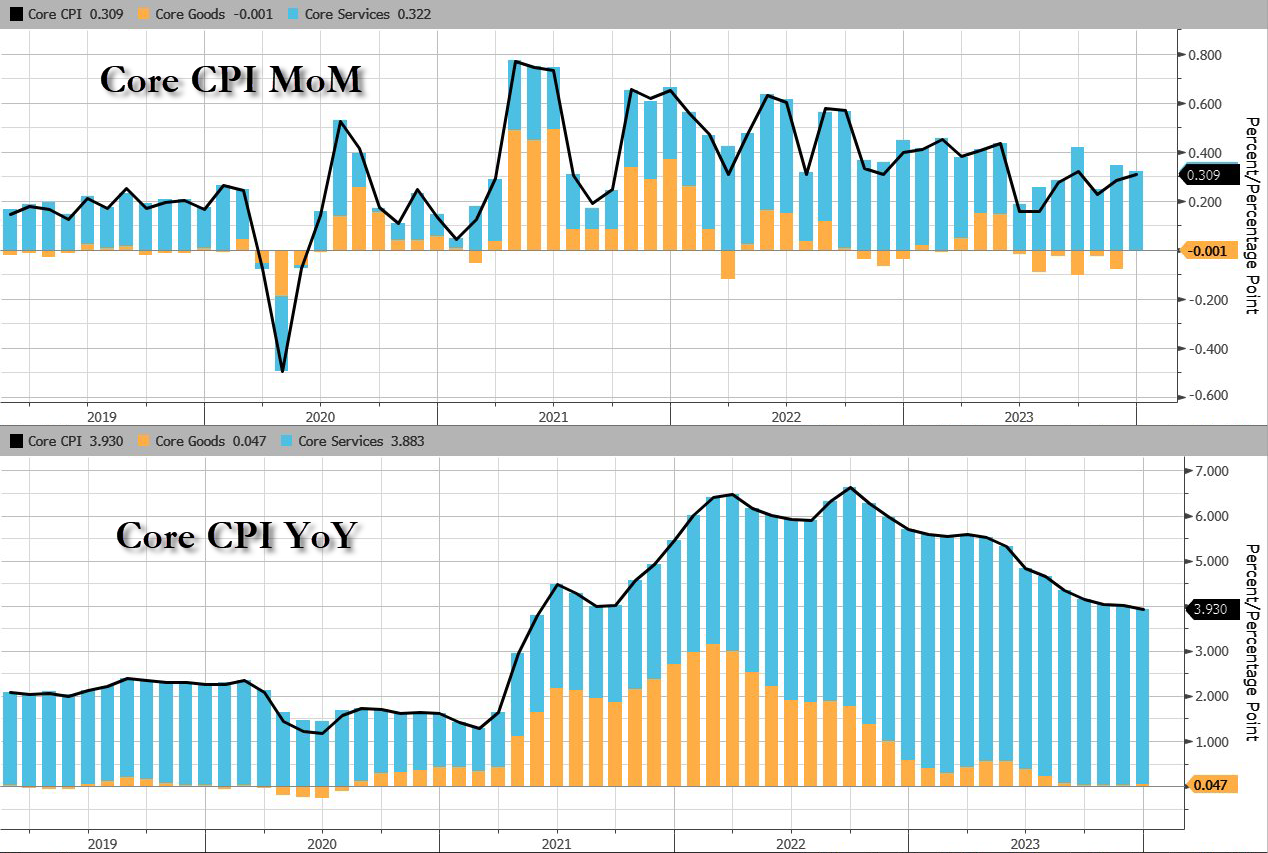
On the brighter side, core CPI rose 0.3% MoM as expected, dropping the YoY change below 4.00% (3.93%) for the first time since May 2021...
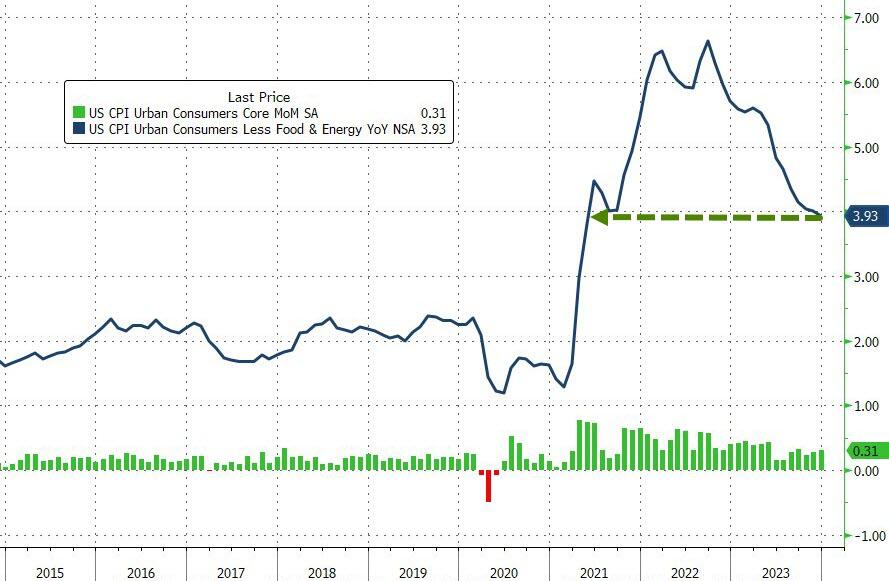
Source: Bloomberg
Goods deflation has stalled as the used cars and trucks index rose 0.5 percent over the month, after rising 1.6 percent in November.
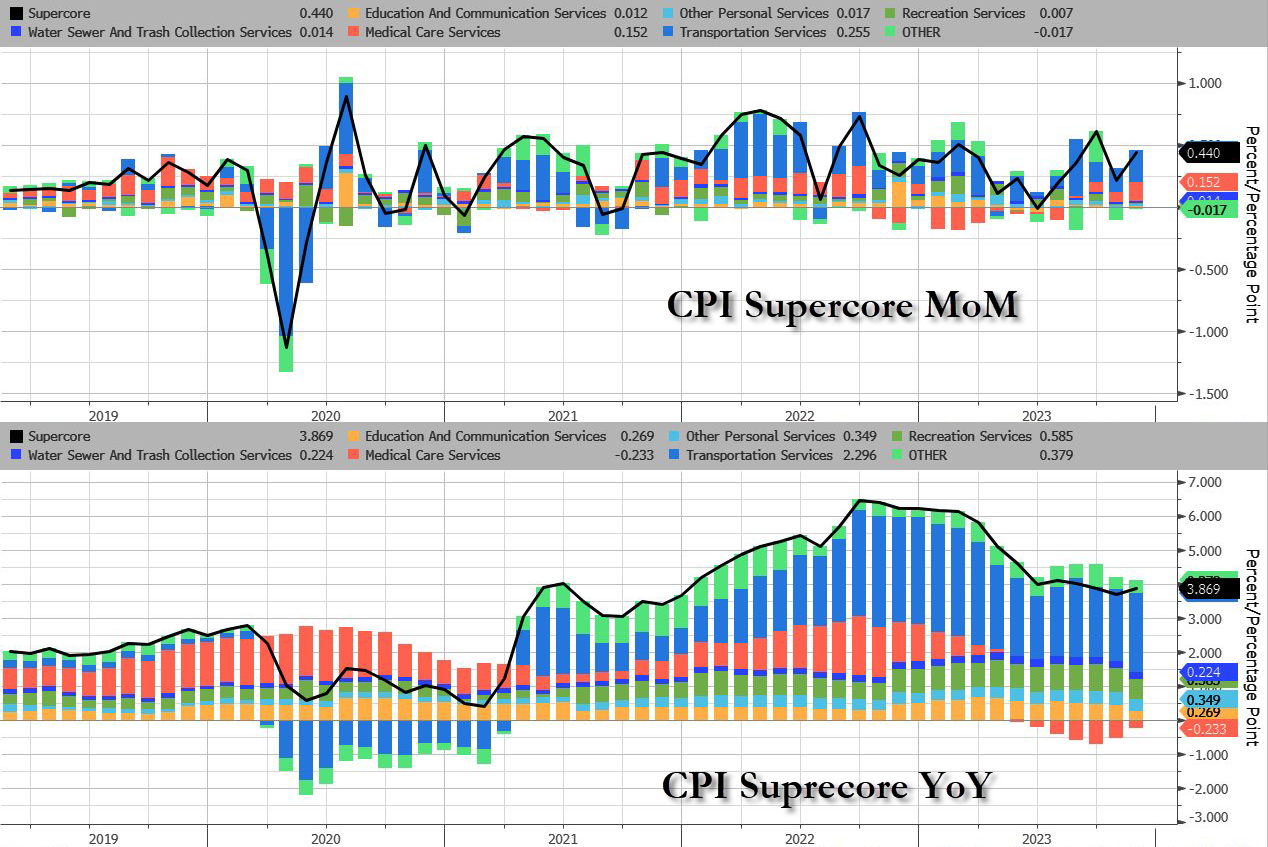
More problematically for The Fed (and the rate-cut 'hypers'), is the fact that Core CPI Services Ex-Shelter (SuperCore) rose 0.4% MoM, upticking the YoY rise to +4.09%...
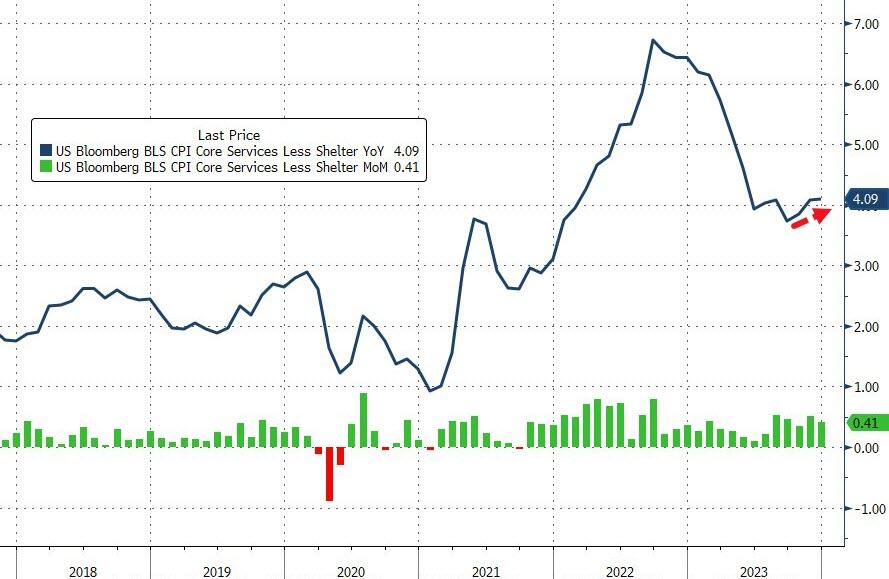
Source: Bloomberg
This is a category that Fed Chair Jerome Powell and other policymakers have highlighted as a focus.
All the subsectors of SuperCore rose MoM with the shelter index increased 6.2 percent over the last year, accounting for over two thirds of the total increase in the all items less food and energy index.
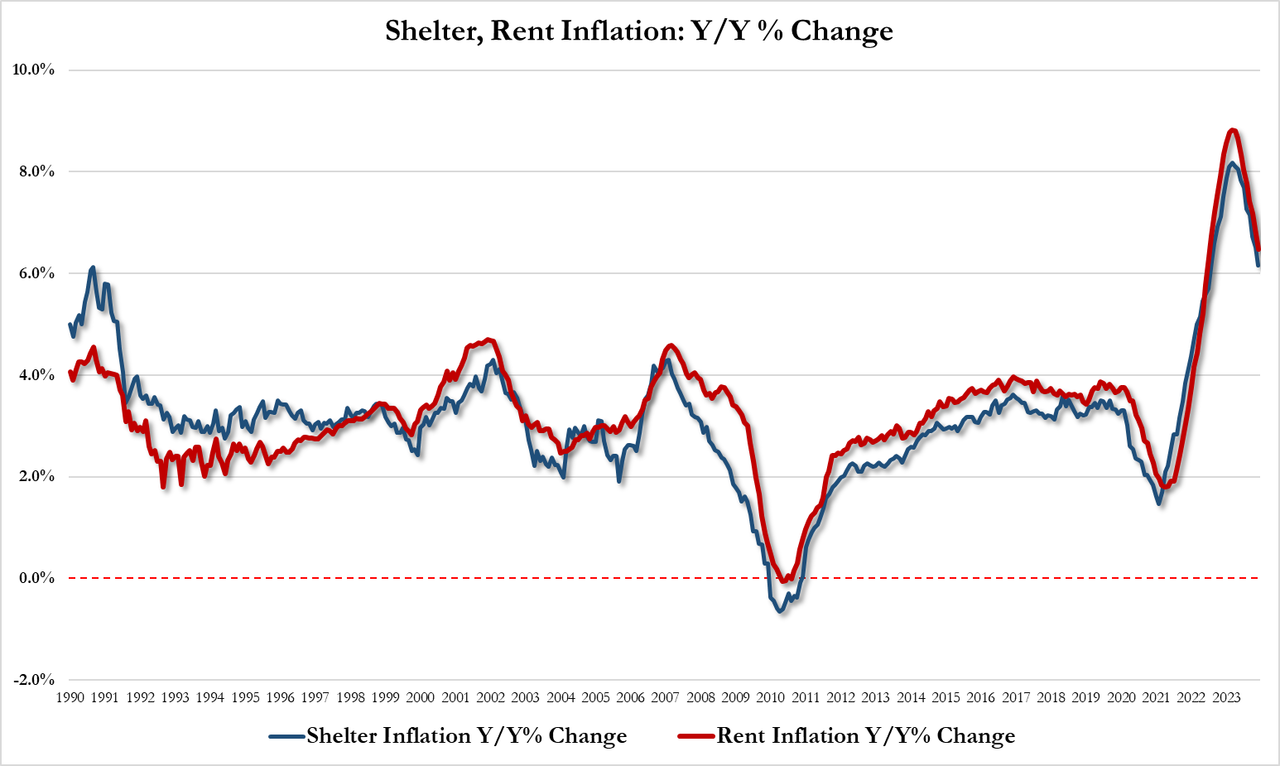
But shelter inflation is slowing (slowly):
Shelter inflation was up 6.15% YoY in Dec, down from 6.51% in Nov and the lowest since July 2022
Rent inflation was up 6.47% YoY in Dec, down from 6.87% in Nov and the lowest since July 2022
And the next time someone from the Biden administration says 'inflation is down' in an attempt to gaslight the public into believing 'prices are down' - show them this chart...
Headline costs at record highs
Core costs are record highs
Food costs at record highs
Fuel costs on the rise again
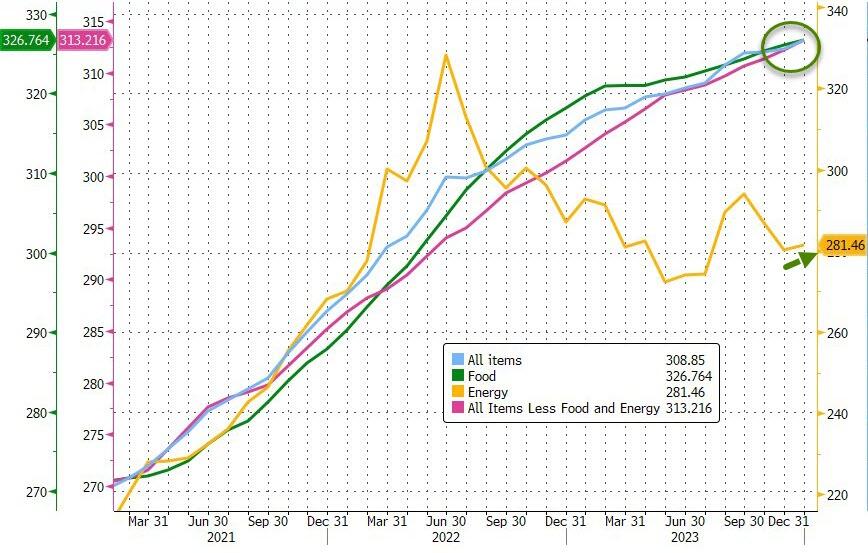
Source: Bloomberg
Four of the six major grocery store food group indexes increased over the month.
The index for meats, poultry, fish, and eggs rose 0.5 percent in December, led by an 8.9-percent increase in the index for eggs.
The index for food away from home rose 5.2 percent over the last year.
The index for limited service meals rose 5.9 percent over the last 12 months, and the index for full service meals rose 4.5 percent over the same period....
October 2023 is the CPI to be reported next week, October 2023 PCE
last week of the month. November CPI reported second week of December.
As goods inflation moderated, led by declines in energy and food commodities as well as food intermediaries (reported in the PPI) services inflation remained stuck.
Now, in addition to sticky services prices, we will be seeing an uptick in goods-manufactured-in-the-U.S. prices as recent wage and salary agreements begin to flow into end pricing. Chinese goods will still have a deflationary bias as that economy has too much stuff manufactured and for sale.
The most troubling area for increased goods prices will be in food where the decline in agricultural commodity prices was never fully reflected in end product groceries (headline CPI) and have now seen some large percentage increases—albeit off a low base—which will be moving through the PPI, raw, intermediary, finished; and thence into the CPI.
Here's an example for folks who don't follow this stuff obsessively. Soybeans and especially soybean oil end up in everything from a fine pork cutlet to salad dressing....
[chart used was dynamic and now shows the last three months rather than Oct/Nov/Dec which illustrated the point being made]
....We'll probably be talking about the crush spread in a month or two.
Meanwhile, corn and wheat appear to have ended their decline for this growing season and though it may be too early to call a bull move, they do seem to be forming a bottom on their respective charts (note switch in time period to emphasize the bigger picture):
If this should come to pass as the U.S. economy slows down it is possible we enter a stagflationary hellscape.
Fortunately there's a trade for that.