Channels for some reason still seem to have a bit of predictive skill, a series of higher lows for example is still a good thing for longs although why a line connecting two or three points should mean anything to a stock price beats me (see chart after jump).
Lately the best results are coming from support and resistance defined as prior stopping places, either up or down.
That's a long intro to a short post.
The S&P closed at 1790.29 on Friday and our best guess is a weakly positive (5-10 points) Monday with lower numbers into the end of the week before a real bottom is reached.
I'd put the odds of this happening-to-script at 50.0099%, cal it 50.001.
From Slope of Hope January 23 i.e. before the big drop Friday:
A Case for 1775
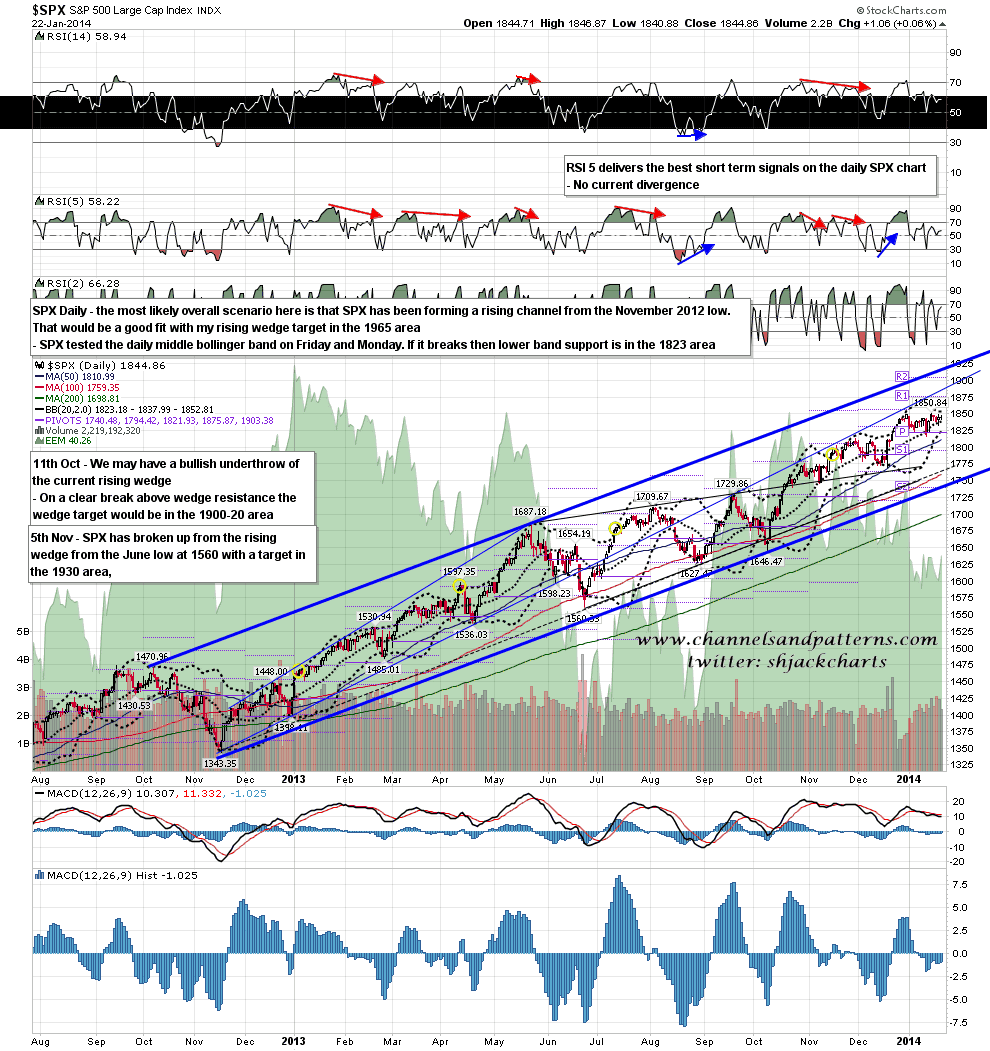
...What if the range breaks down rather than up? I mentioned on 19th November after a rare punch up through the weekly upper bollinger band that historically there was a strong case for seeing a 4% retracement starting not too far above that punch. SPX was at 1800 at the time and if we were to see a 4% retracement from the current 1850 high that would target the 1776 area. I have decent trendline support and the weekly middle bollinger band in the 1775 SPX area, and on the 60min chart (not shown today) I have a possible double-top that would target the 1815 low on a break below the current range..On a break below the 1815 low the larger double-top target would be that 1780 target. SPX weekly chart...
...Where is main support on SPX from here if we do see a sharp decline? Well the last low was at 1767.99, and rising support from the November 2012 low at 1343.35 is at now in the 1735-40 area. Daily lower bollinger band support is at 1824, but the tight pinch we are seeing on the daily BBs at the moment is signalling that a large move is coming. Obviously there is room for that move to be down. That wouldn’t invalidate my 1965 wedge target either, though it would make to move towards it much more profitable to trade. SPX daily chart:
(click through to enlarge)
...MORE Another post at Slope of Hope had this chart of the Russell 2000:
