From Dragonfly Capital:
Recent Inflation Will Abate
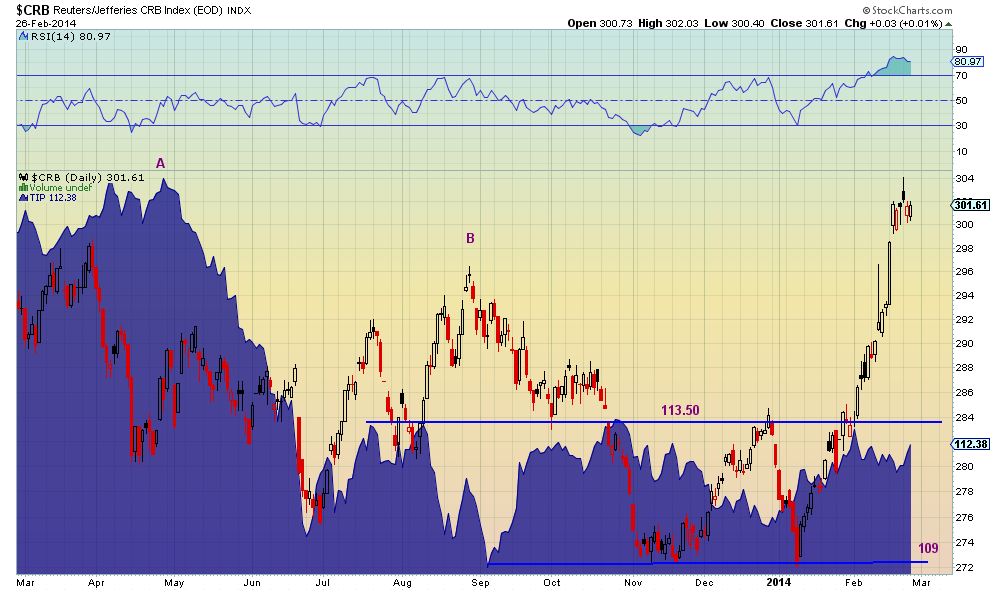
That is what the Bond Market is saying. The chart below shows the the CRB Index (an inflation measure) with the Treasury Inflation Protected Bonds ($TIP) as the blue area. The TIP’s are the Bond market equivalent of a measure of inflation as they adjust to protect holders from losing value due to changes in inflation. These bonds have been right before too. Looking at point A as the CRB Index started to fall so did the TIP’s, indicating inflation would be lower. At point B the TIP’s refused to follow the CRB Index higher and it did fall back. Now with the spike from the middle of January TIP’s are refusing to follow again. And over the last week the CRB has consolidated, printing a Shooting Star reversal candle in the middle of the consolidation. Momentum is waning as well with the Relative Strength Index (RSI) hitting 80 and leveling.

...MORE