The stock got through the $190 -195 resistance* and traded as high as $252.37 on Friday July 5th but now it is acting tired and will need some news to keep the interest of the spec crowd.
$249.07 last, down $2.45 (-0.97%) in pre-market trade.
From Investopedia, July 7:
Watch These Tesla Stock Price Levels After Last Week's Huge RallyShares Gained 27% Last Week to Move Into Positive Territory for 2024
Key Takeaways
- Tesla shares surged 27% last week, boosted by a better-than-expected second-quarter deliveries report and building anticipation ahead of the company's Robotaxi Day next month.
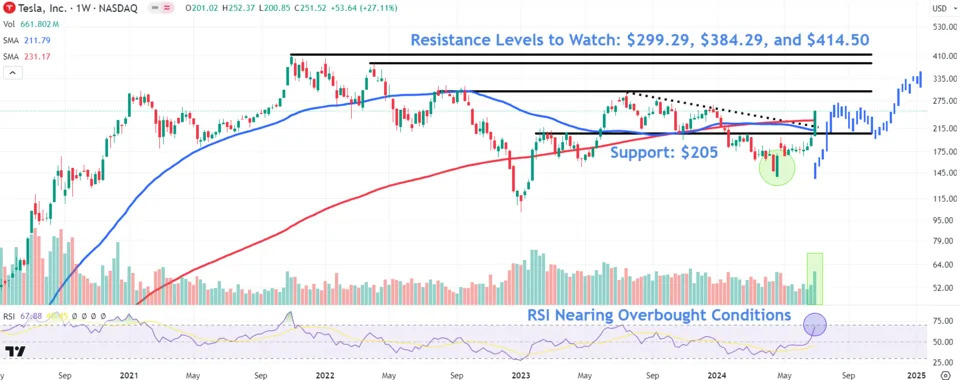
- Last week, Tesla shares closed above both the 50- and 200-week moving averages and a prominent 12-month downtrend line on the highest trading volume since mid-February, indicating buying conviction among market participants.
- Tesla shares may encounter resistance on the weekly chart at $299.29, $384.29, and $414.50, while potentially finding support around $205.
Tesla (TSLA) remains in the spotlight after a 27% surge in the EV maker’s share price last week drove the stock back into the green for the year. The rally followed a better-than-expected second-quarter deliveries report on Tuesday and building anticipation ahead of the company's Robotaxi Day next month.
Amid the strong recent price momentum, we use technical analysis to identify key areas on Tesla’s weekly chart to watch out for.
Breakout Above Key Chart Indicators
Tesla shares have been tracking higher since the completion of a piercing pattern in late April. Typically, technical analysts interpret this two-bar candlestick formation as signaling a potential reversal from a downward trend to an upward trend.Last week, the stock closed above both the 50- and 200-week moving averages and a prominent 12-month downtrend line on the highest trading volume since mid-February, indicating buying conviction among market participants. Moreover, the relative strength index (RSI) nears overbought territory, confirming the strong recent price momentum.
Levels to Watch Amid Further Upside
If the stock continues to climb higher, investors should focus on three key chart levels....
....Until TSLA decisively breaks through the resistance line, roughly $190—195 the post from January 25 is still operative:
Tesla Roundup: Dead Money For, At Minimum, A Couple Quarters (TSLA)
In late pre-market action the stock is down $18.03 (-8.68%) at $189.80....