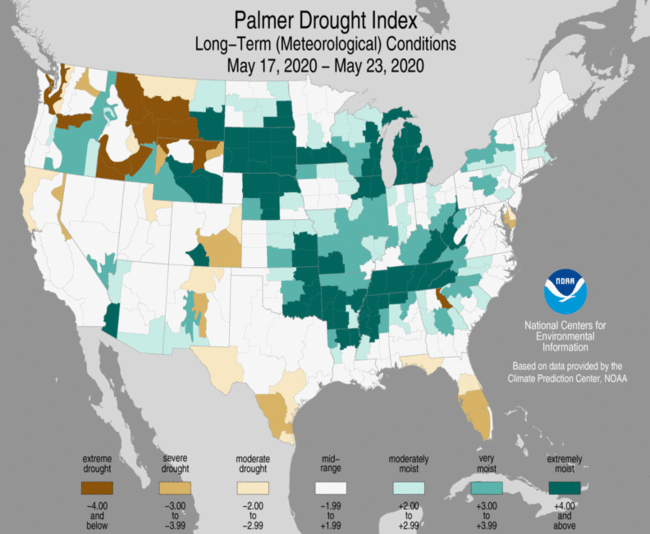
According to the latest maps, Southern California is still in a drought.The two major drought conditions visualizations are still giving disparate views of the situation but they are coming together. Both via the NIDIS U. S. Drought Portal.
But the dry conditions that have mired the region for more than five years have definitely shifted — at least for now.
Sunday’s huge storm — which dumped nearly 4 inches of rain in some areas — is part of a wetter trend that began in the fall. Since Oct. 1, downtown L.A. has received more than 13 inches of rain -- 216% of normal for this period, which the National Weather Service said was 6.26 inches.
It’s a remarkable turnaround.
Over the summer, the National Weather Service announced that the past five years were the driest ever in downtown L.A. since official record keeping began almost 140 years ago. Precipitation during those five years totaled just 38.79 inches — roughly half of normal.
Forecasters had predicted a wet 2016 fueled by El Niño, but the big storms never materialized.
Until recently, officials were seeing a divergence in the state. Storms in Northern California were quickly easing the drought. But the drought persisted in Southern California.
According to the U.S. Drought Monitor, swaths of Northern California are now out of drought due to pounding storms that replenished the Sierra snowpack and filled reservoirs.
Since Oct. 1, total precipitation in the Sierra Nevada has been soaring at rates similar to the wettest winters in the modern record: 1982-83 in the northern and central Sierra and 1968-69 in the southern Sierra.
As of last week, Lake Shasta, the state’s largest reservoir and a major source of water for San Joaquin Valley agriculture, is 82% full and releasing water to create more storage room. Oroville, which supplies the State Water Project, is 77% full and also making releases...MORE
First up, the U.S. Drought Monitor maintained by the University of Nebraska-Lincoln:
NOTE: To view regional drought conditions, click on map above. State maps can be accessed from regional maps.
And NOAA's Palmer Drought Index which has given a more accurate representation over the last year or so:
