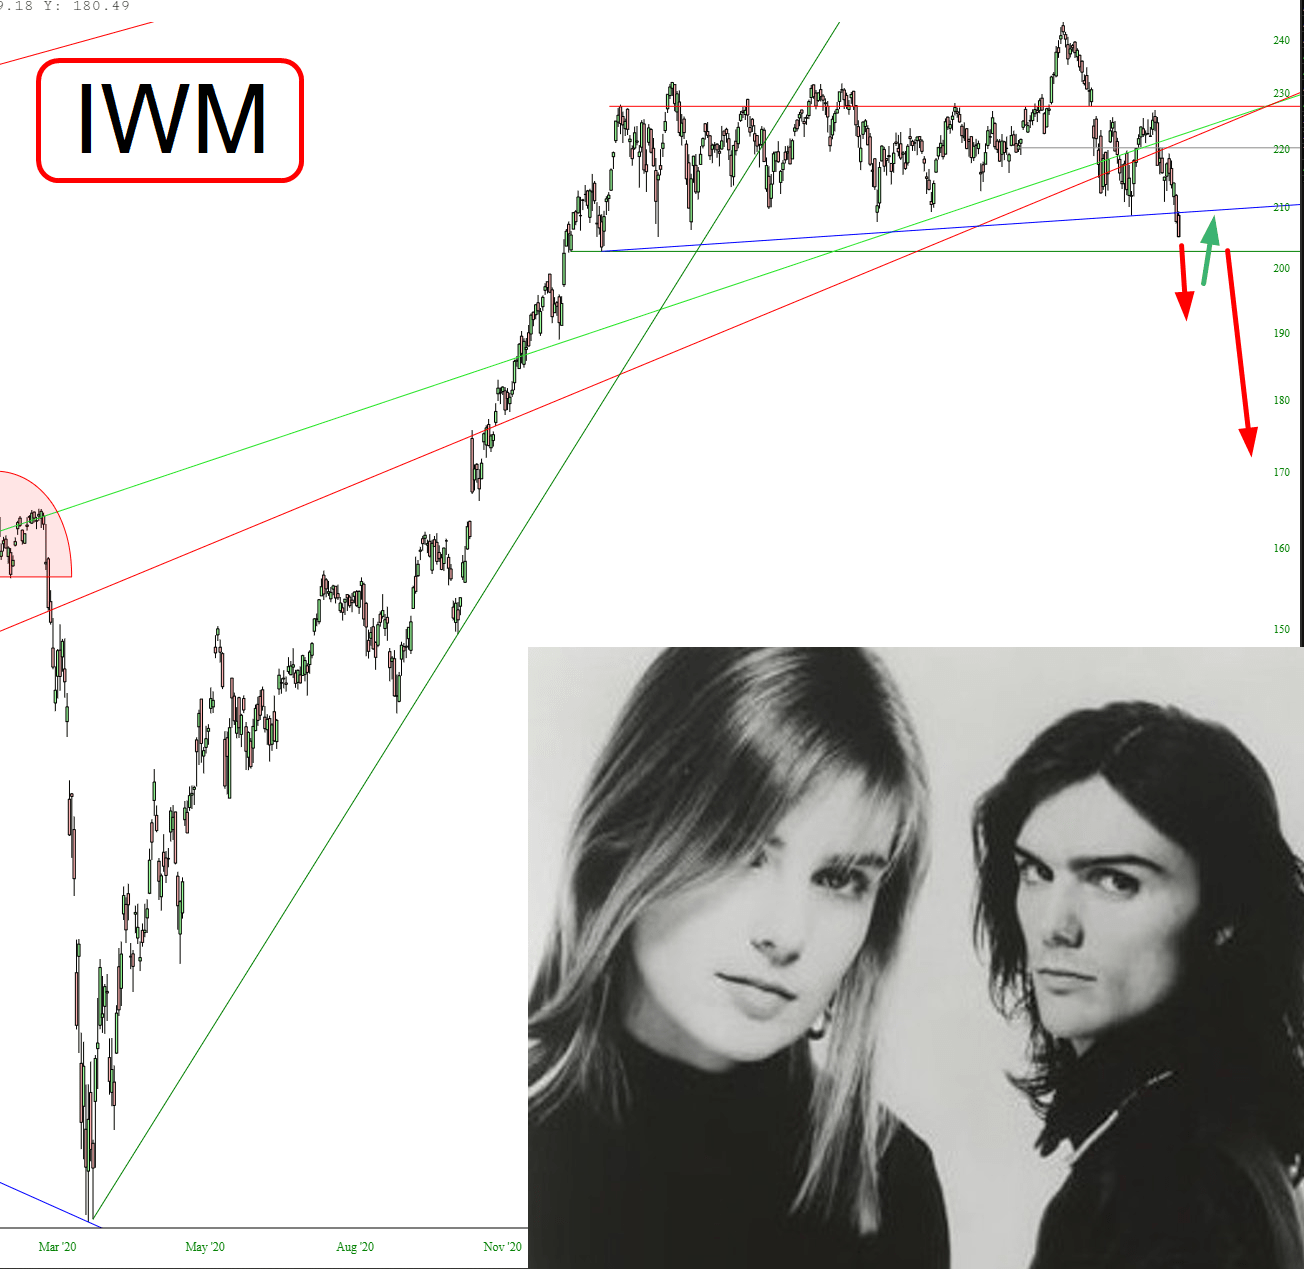
Mr. Knight has been sharing his revery of a breakdown in the Russell 2000 ETF peddled by BlackRock's iShares subsidiary for months, and now that it has broken decisively below the 210 level where previous declines had reversed:
One of our links to Slope on the small caps was November 23's "Chartology: Remember The Chart Pattern That Preceded The Drop In Beyond Meat? (IWM; BYND)":
We try to filter for busy reader the higher probability directional bets.Not necessarily the highest risk/reward or possible return and definitely not some of the combination trades you can put together with derivatives. Just Up or Down. If you get that right, even just 51% of the time, you are halfway home to the fancier stuff. Or, as the four basic combinations were called back in a more testosterone-y, less dopamine-y trading environment: Strip, Strap, Straddle and Spread.
With that longer than usual introduction here are the two charts that Tim Knight at Slope of Hope proffered that elicited a "Saaaay, I've seen that pattern before"....
That post somehow swerved off into archi-technical rambling but I think it got the point of the exercise across. If not, there were a half-dozen others including this from August:
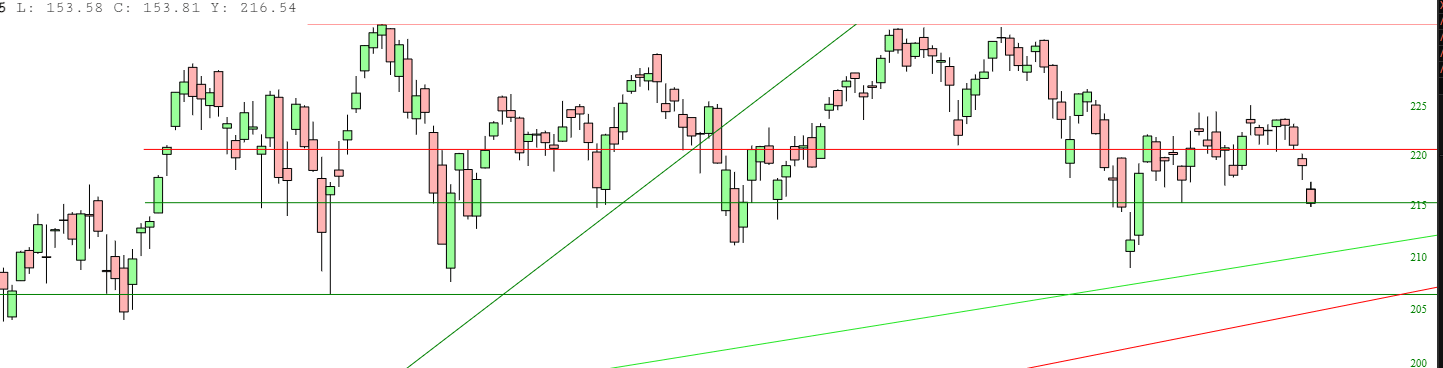
Equities: "Small Cap Range"
People who spend too much time at the market have this image burned into their retinas but it is worth highlighting, if for nothing else, the opportunity to see how these things resolve....